What Makes the Golden State Valkyries Unique?
An end-to-end analysis of an expansion team's first two seasons: How it went from 23 wins to 32, how its players/roster work together, and what to expect in upcoming seasons.


THE QUESTION
What is the reason behind this team's wins and how is it built to create a winning culture?

THE SOLUTION
The Valkyries did not score more. Instead, they allowed less, shared the work, and stayed healthy and together.
HOW I GOT THERE

PART 1: DEFENSE
The Valkyries win by stopping the other team from scoring
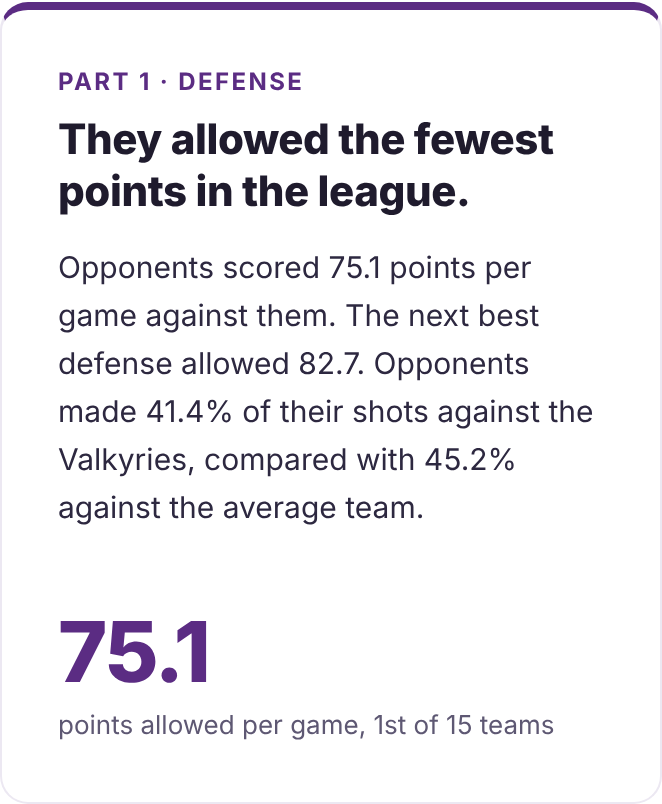
The Valkyries allowed the fewest points in the league because opponents had trouble making shots against them. Shot locations show part of the reason. The easiest shots in basketball are the ones taken close to the basket, and opponents took fewer of those against the Valkyries: 49% of their shots, compared with 52% against everyone else. The first chart below shows how far the team sits from the others in points scored and points allowed, and the second shows where opponents shot from.
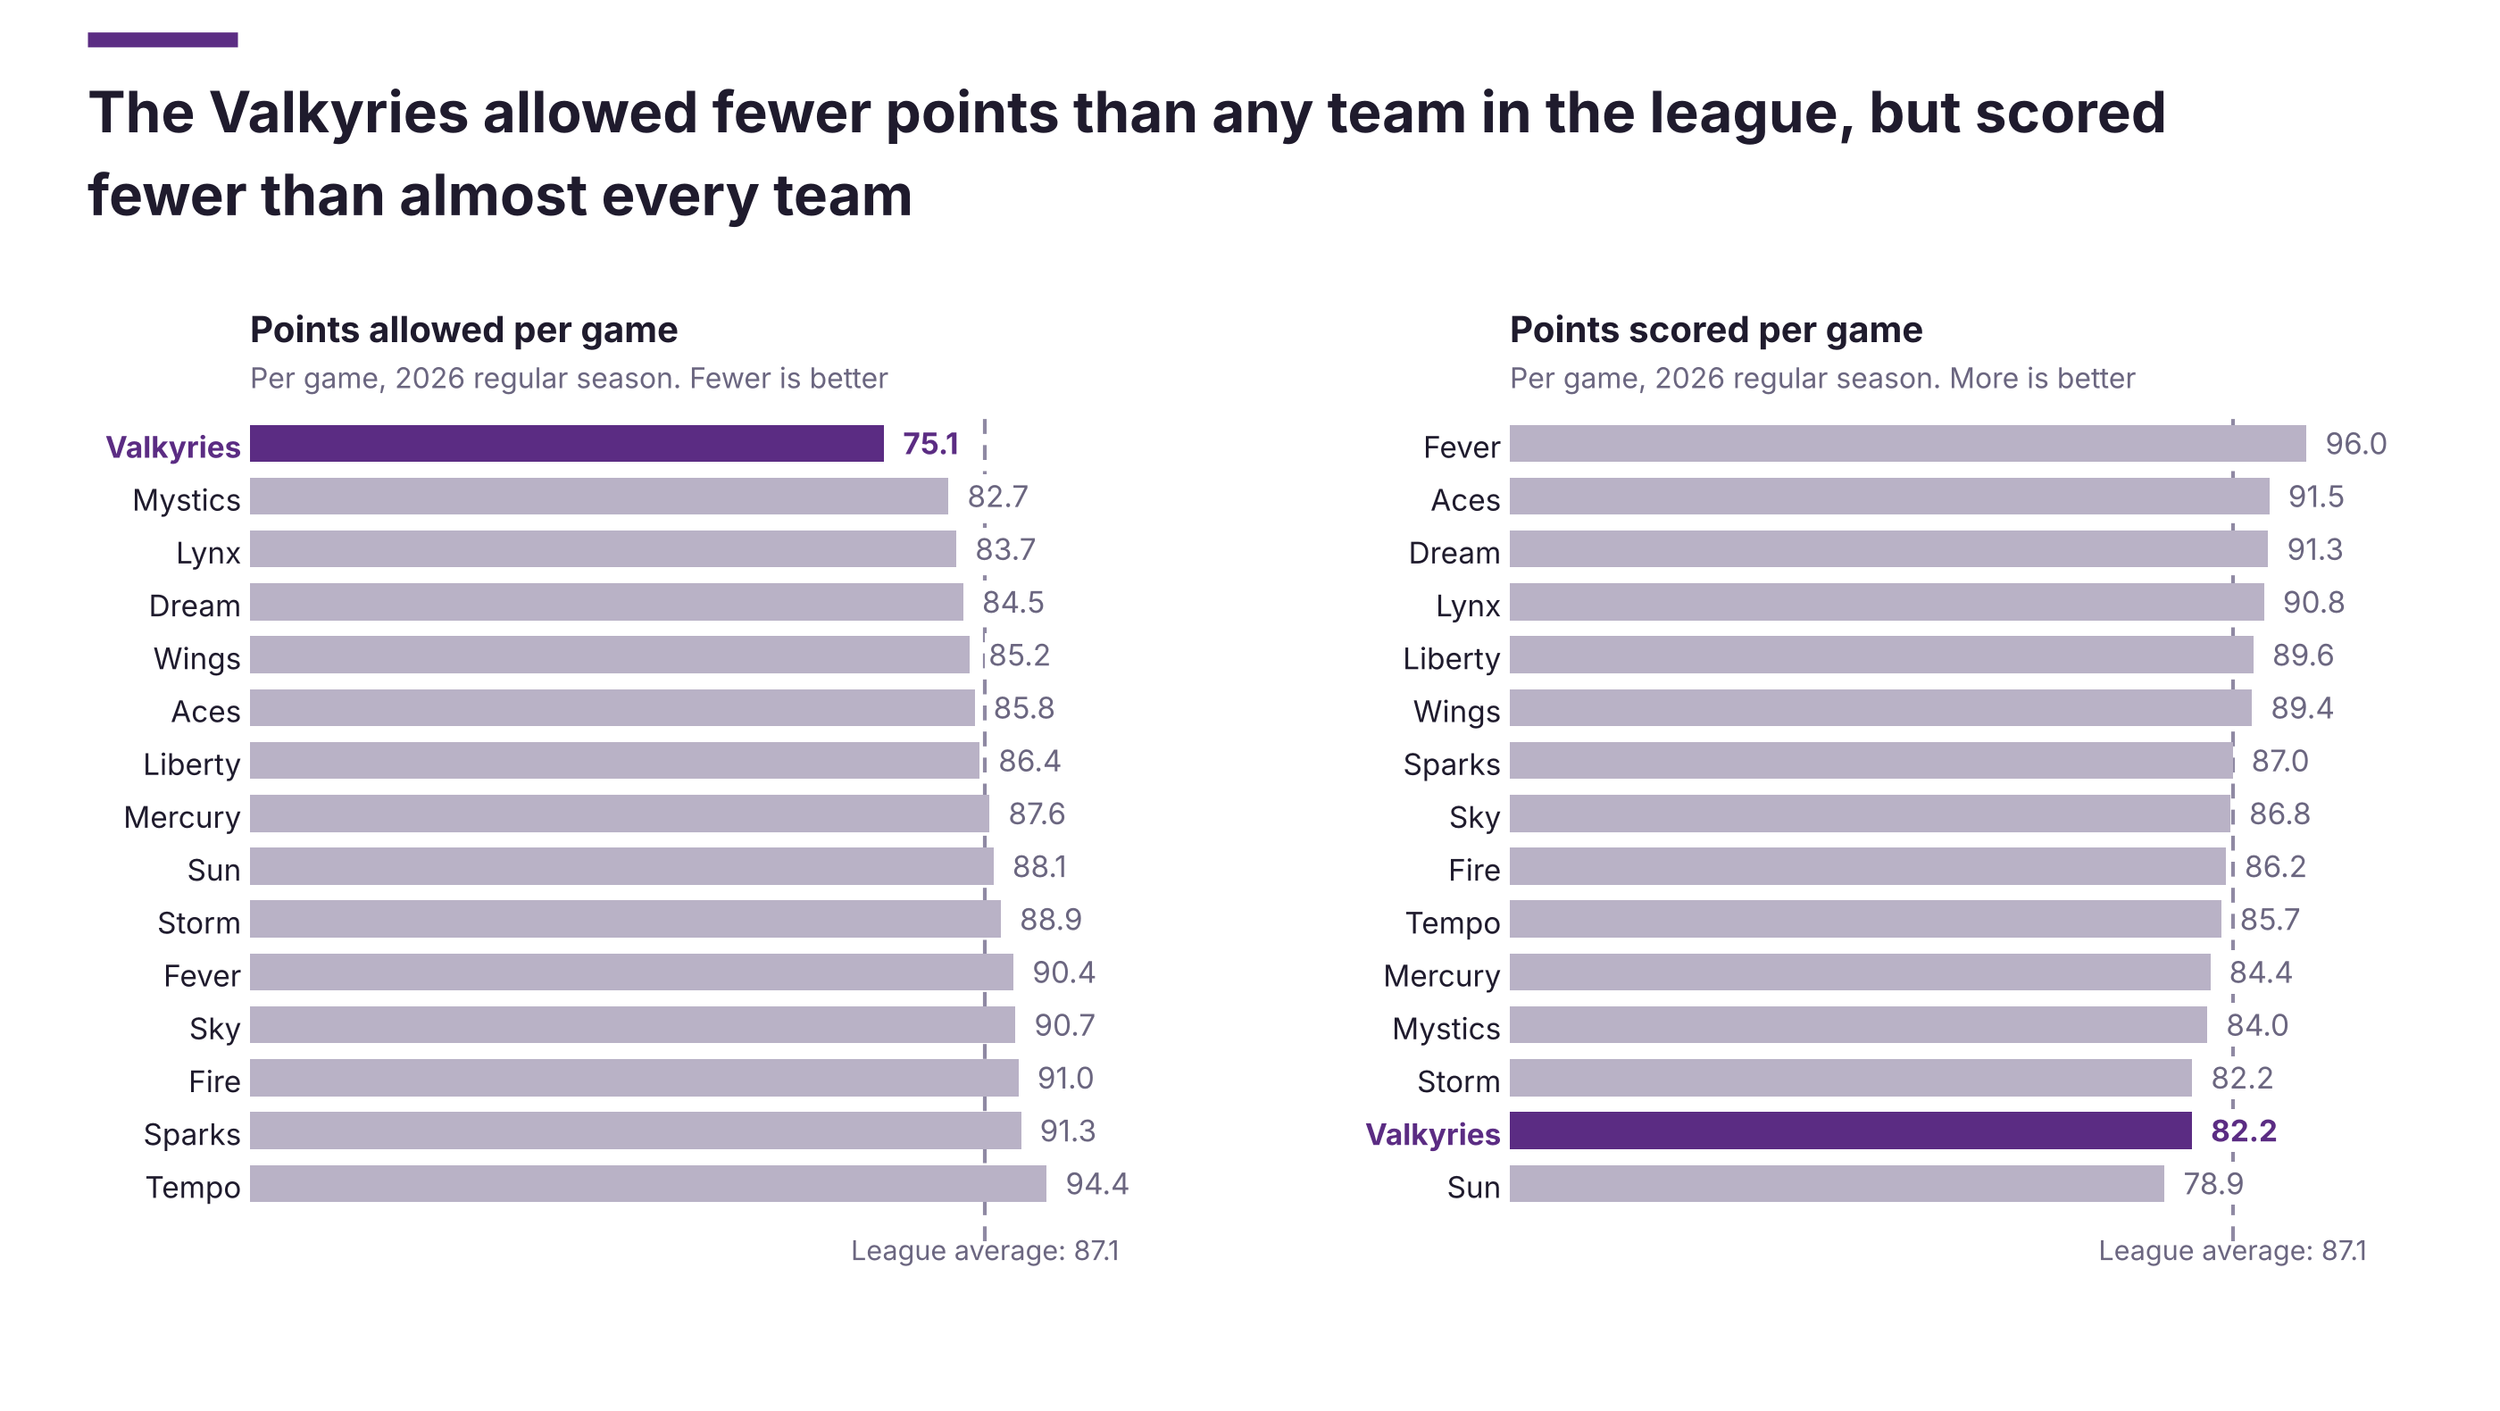
This chart tests the first obvious explanation, that the Valkyries won because they scored more or allowed less. The left panel ranks all 15 teams by points allowed per game, with the shortest bar first, and the right panel ranks them by points scored. The Valkyries are purple, the dashed line is the 87.1-point league average, and showing every team keeps the comparison fair. The raw result looks lopsided: the team allowed 75.1 points, which is 7.6 fewer than the next team, the Mystics (82.7), and 12.0 below the league average, but it scored 82.2, 14th of 15.
Before trusting that picture, I checked whether it is an artifact of pace, because a team that plays fewer possessions will have lower totals on both sides. The Valkyries played the slowest pace in the league, 78.4 possessions per game compared with 83.4 for the other teams. When I put both sides on a per-100-possession basis, the picture changes. Their defense still ranks first, allowing 95.9 points per 100 possessions compared with 105.4 for the other teams. Their offense, though, scores 104.6 per 100 possessions compared with 104.8, which is average and ranks 7th.
This corrects my first reading. The offense was not weak, it was average, and the team's low point total mostly reflects how slowly it played. The defensive advantage is smaller than the raw gap suggests, 9.5 points per 100 possessions instead of 12.0 points per game, but it is still the largest gap between the Valkyries and any other measure and the clearest source of the wins. The honest conclusion is that the team won with an elite defense, an average offense and a slow tempo.
This is central to the story because it points the rest of the analysis at the right target. If the defense is real and not a pace artifact, the next charts should explain how it worked (shot locations), and the later parts should test what supported it. It also raises a question I could not answer with this data: whether the slow pace was a deliberate choice that helped the defense, or a result of it. That would need possession-level and tracking data.
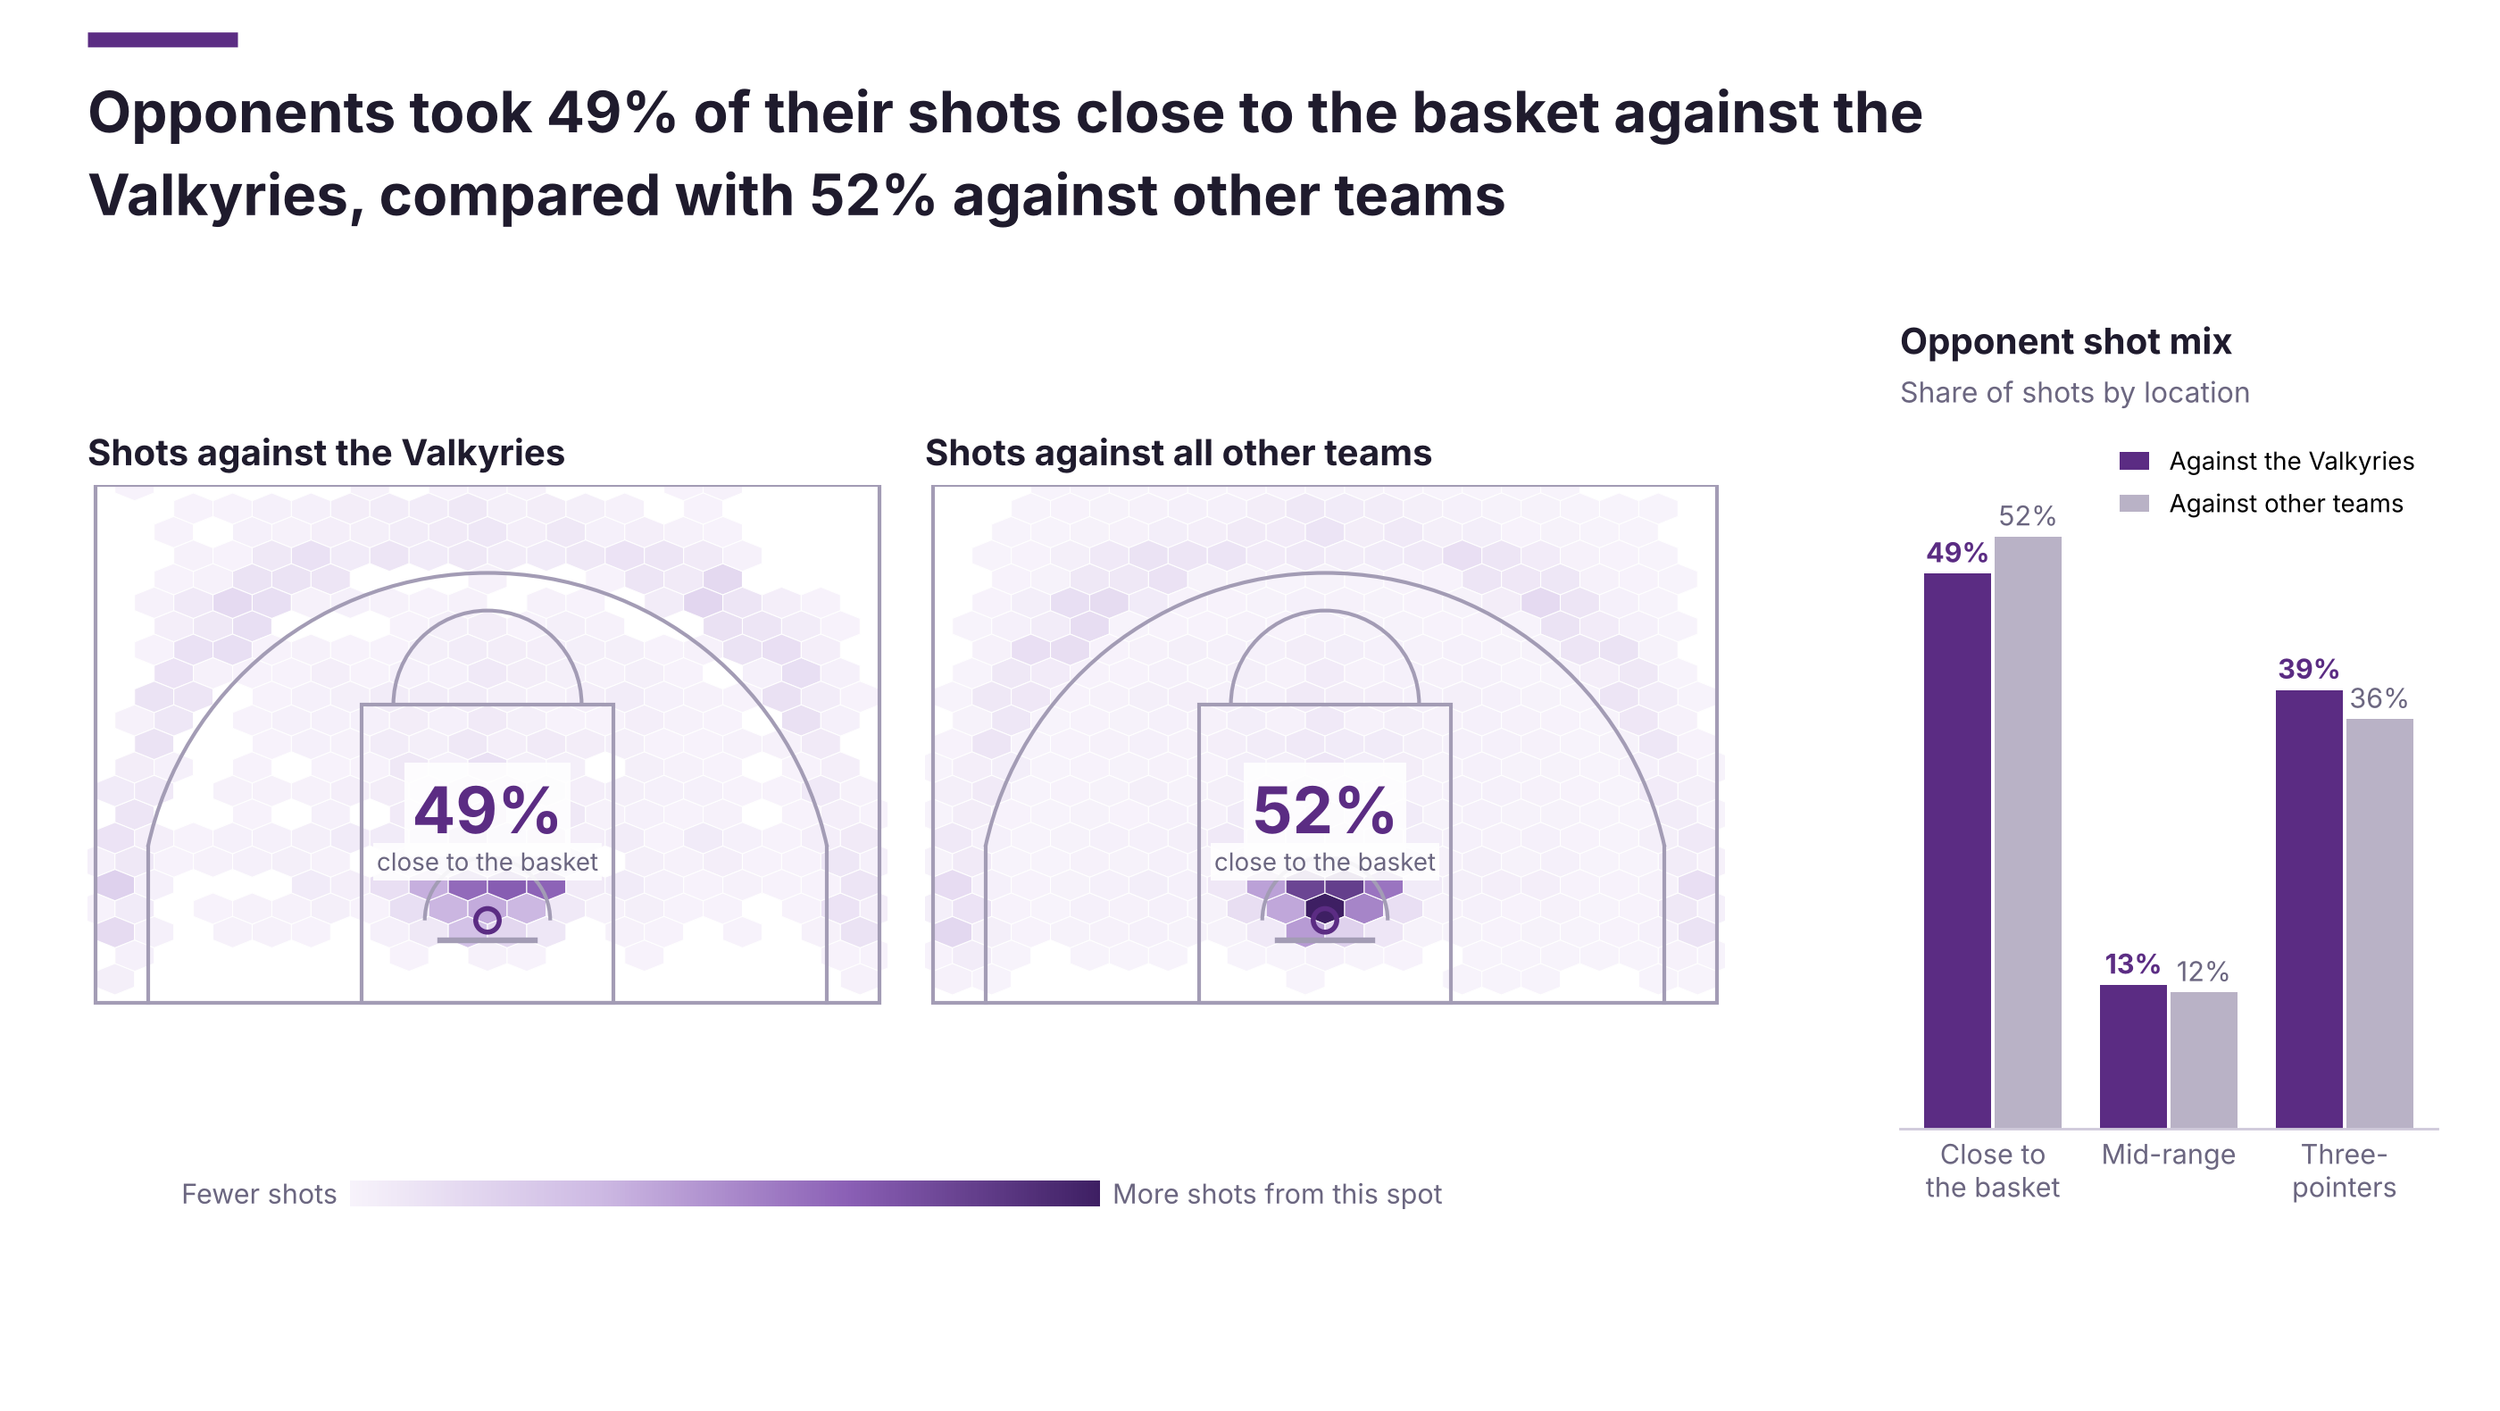
This chart asks how the defense produced its result. The two courts show where opponents shot from, with the basket at the bottom, the left court for shots against the Valkyries and the right court for shots against other teams, on the same color scale. The bars on the right group the shots into close to the basket, mid-range and three-pointers. Against the Valkyries, 49% of opponents' shots were close to the basket, compared with 52% against other teams, and the three-point share was 39% compared with 36%.
The easy reading is that the Valkyries steered opponents toward worse shots, so I tested how much of the accuracy gap that explains. In the shot-location data, opponents made 41.4% of their shots against the Valkyries and 46.0% against other teams, a gap of 4.5 points. I split that gap into two parts: the change in where opponents shot from, and the change in how well they shot from each spot. The shot mix explains only about 0.6 points, roughly 14% of the gap. The other 3.9 points, 86%, come from lower accuracy within each area: 5.0 points lower close to the basket, 5.4 points lower from mid-range and 2.0 points lower on threes.
The sample is large enough to trust this. There are 2,746 shots against the Valkyries, which gives a margin of error of about 1.8 points, smaller than the 4.5-point gap. So the evidence says the defense mostly made shots harder in every area and did not mainly change the shot map. That changes what I would tell a coach: the result came from contesting shots and not mainly from funneling them.
This matters because it turns a ranking into an explanation, and it corrects a more convenient story. It also shows the limit of public data: shot data does not say how closely each shot was guarded or who was responsible, so I cannot separate team scheme from individual defenders. The next test would be to see whether the lower accuracy holds across different opponents and lineups, which would show whether it is a stable skill or partly luck.
PART 2: TOGETHERNESS
No single player carries them. They play as a unit rather than focusing on key individual players who carry them.
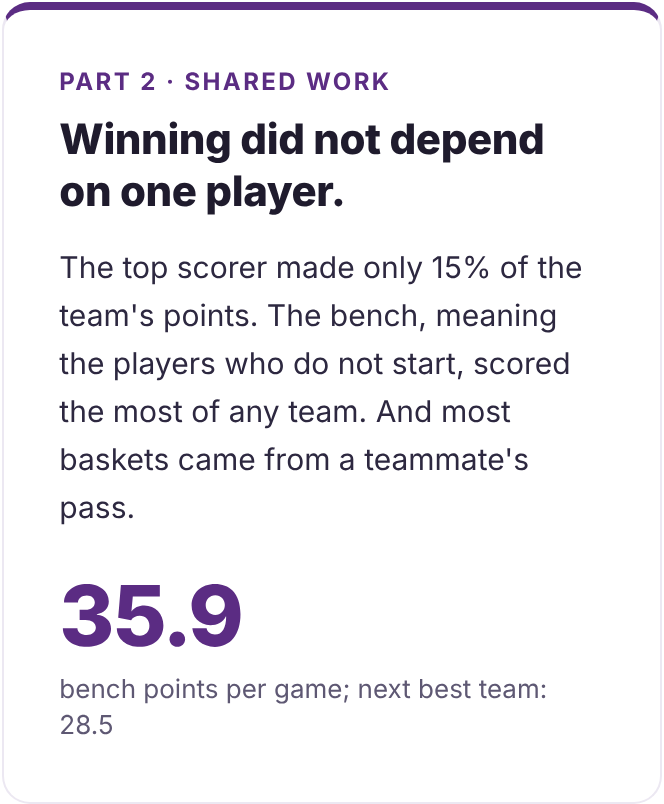
No single player carried the Valkyries. Gabby Williams was the top scorer at 14.4 points per game, and Williams, Salaun and Burton shared the lead among scorers. The bench scored 35.9 points per game, up from 24.3 in 2025, and the team gave the ball away less often than any other team, 10.4 times per game compared with 12.9 in 2025. Most baskets were assisted, meaning a teammate passed the ball to the scorer. The charts below show the bench, the top three scorers and who passed the ball most.
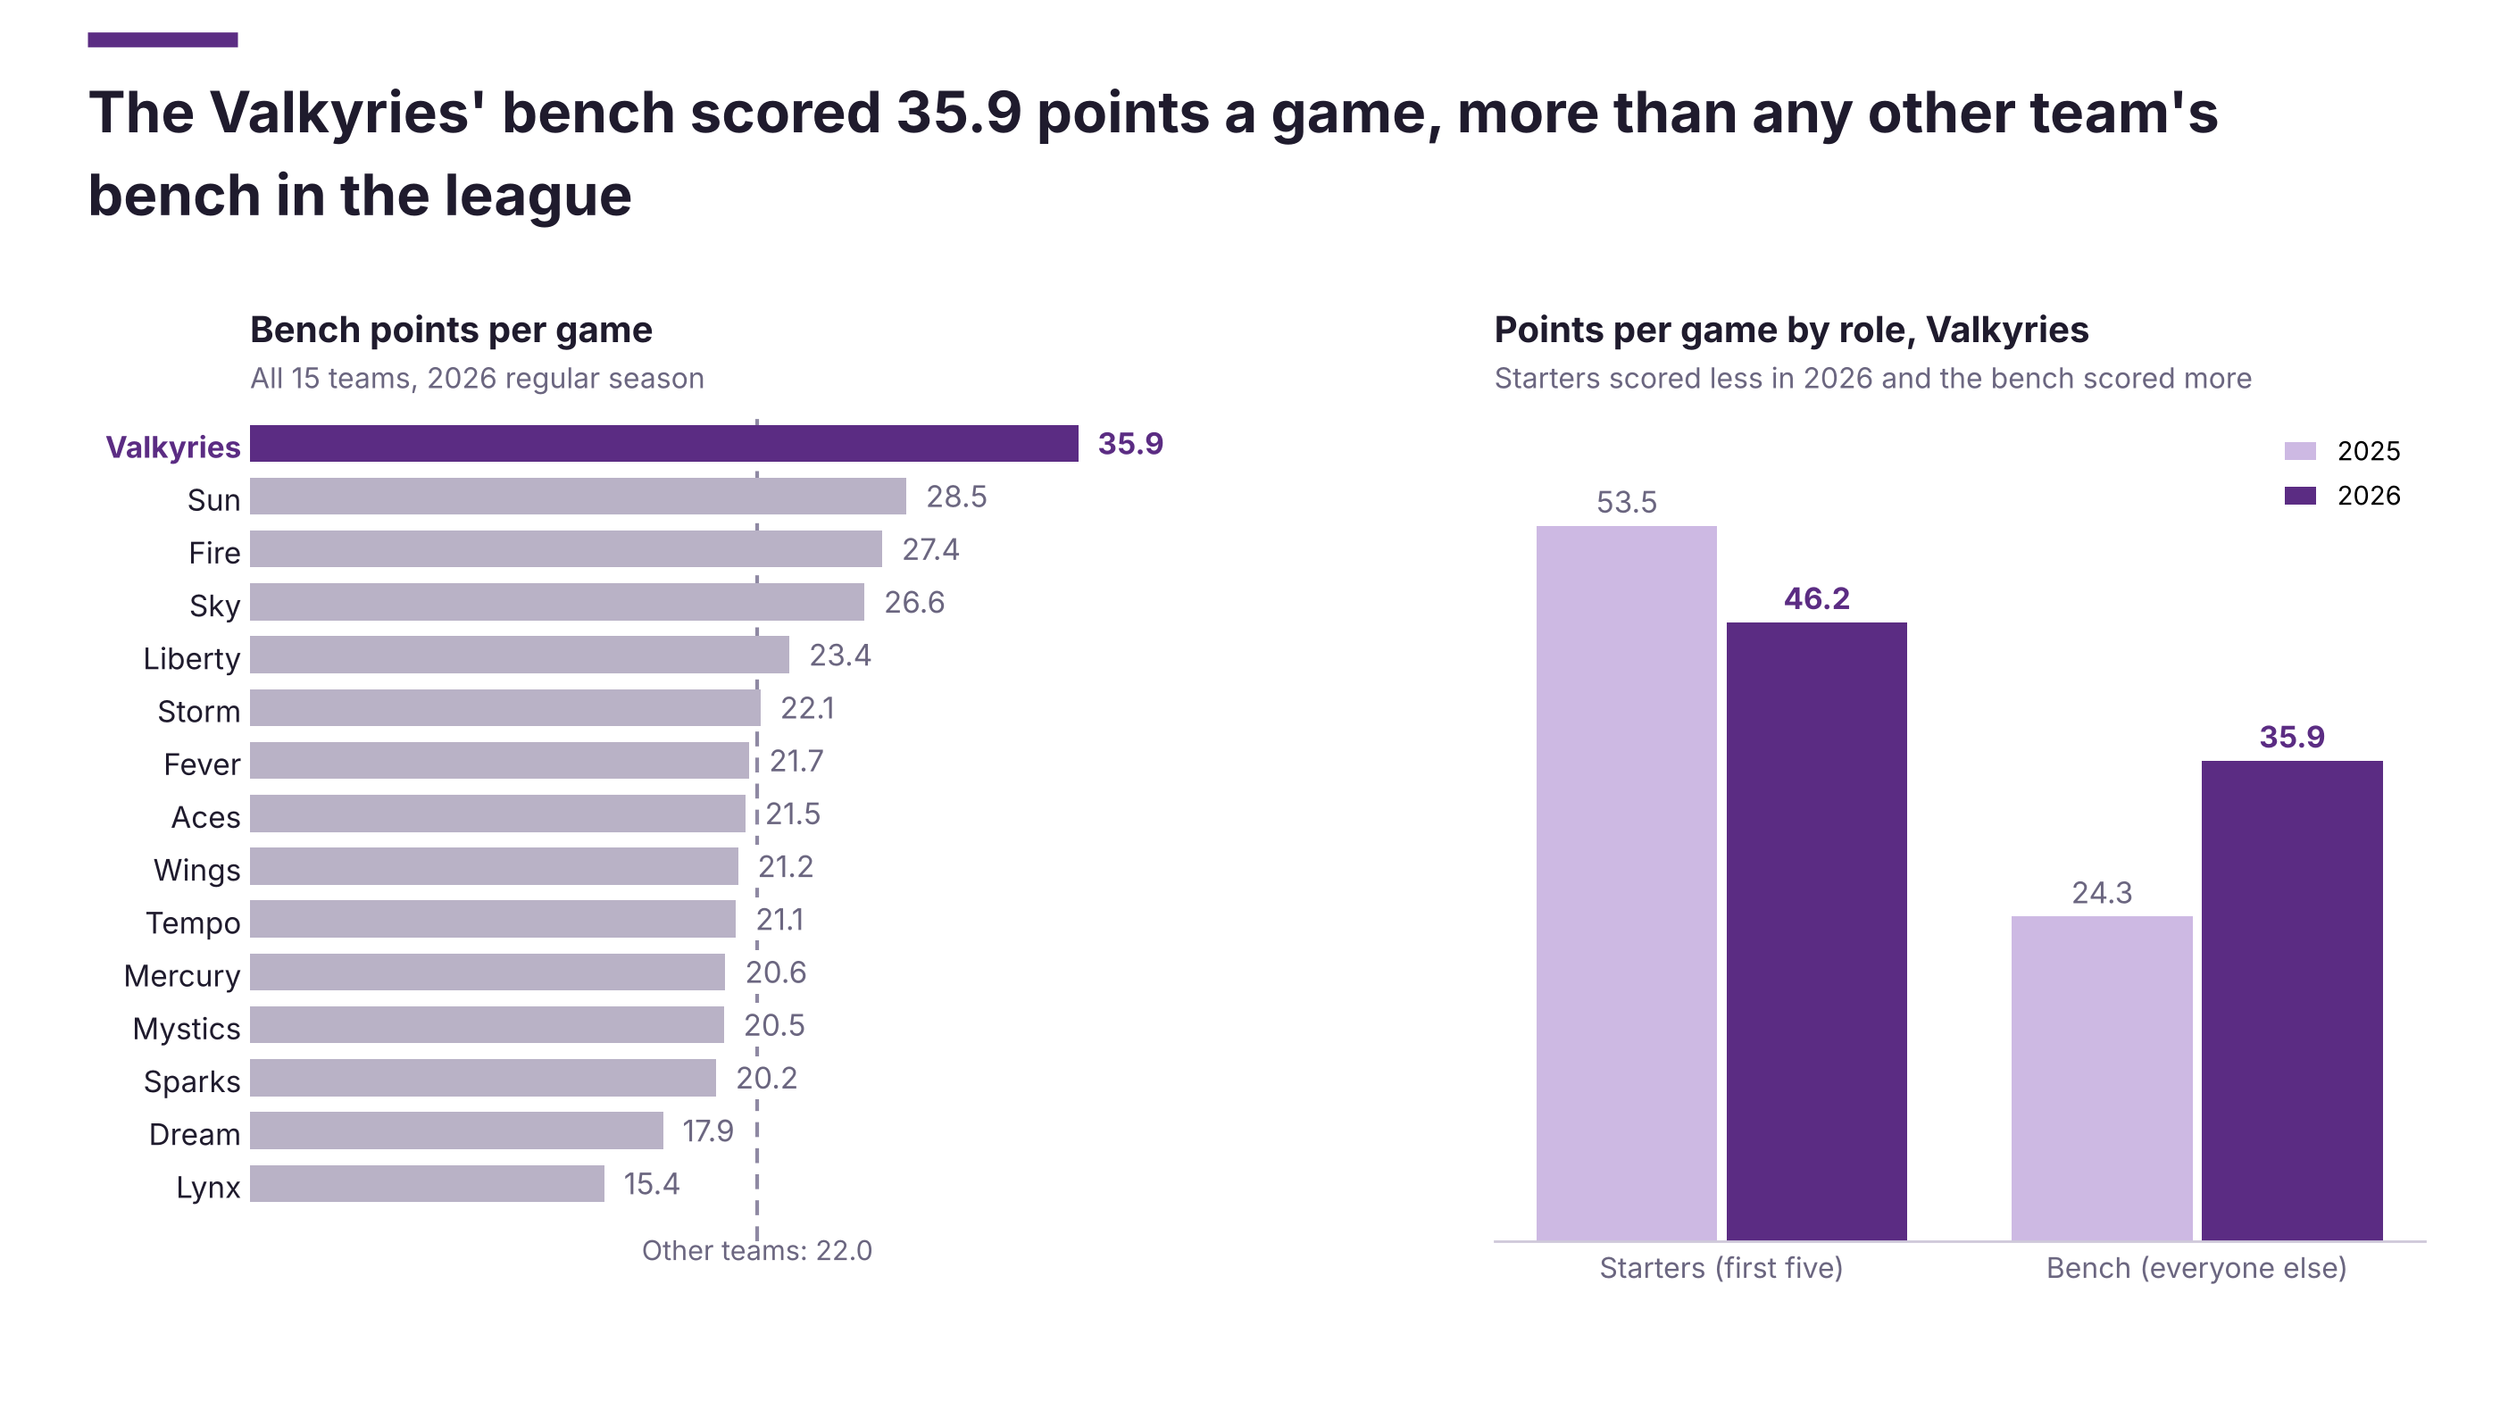
This chart examines the second unit. The left panel ranks all 15 teams by bench points per game, and the right panel is a bridge chart showing how the team's combined starter and bench scoring changed. The first bar is 2025, the gray bar is the change from the starters, the purple bar is the change from the bench, and the last bar is 2026, so the steps add up from left to right. The Valkyries' bench scored 35.9 points per game, the most in the league, with the Sun second at 28.5 and the other teams averaging 22.0.
Combined starter and bench scoring rose from about 77.7 to 82.2 points per game. The starters scored 7.2 fewer points and the bench scored 11.6 more, so the bench gain more than covered the loss and raised the total by about 4.4 points. A big bench total can come from two sources, more minutes or better scoring per minute, so I separated them. The Valkyries' bench played 39.9% of the team's minutes compared with 31.5% for the other teams, the highest share in the league. It also scored 0.45 points per minute compared with 0.35 for the other teams, also first. The starters scored 0.38 points per minute compared with 0.47 for other starters.
This is a more interesting result than a high total. The coaching staff gave the bench a larger role, and the bench was more productive per minute than the starters, which suggests the roster was deep and not that the starters were resting. The caution is that bench points can be inflated in games decided early, when starters sit, and I did not remove those games.
This matters because it supports the idea that the improvement came from depth and not from one lineup. For the story, it moves the analysis from defense to the structure of the roster, and it sets up the next charts on how the scoring and passing were shared. A good follow-up is the same comparison in close games only, which would show whether the bench held up when the result was still in doubt.
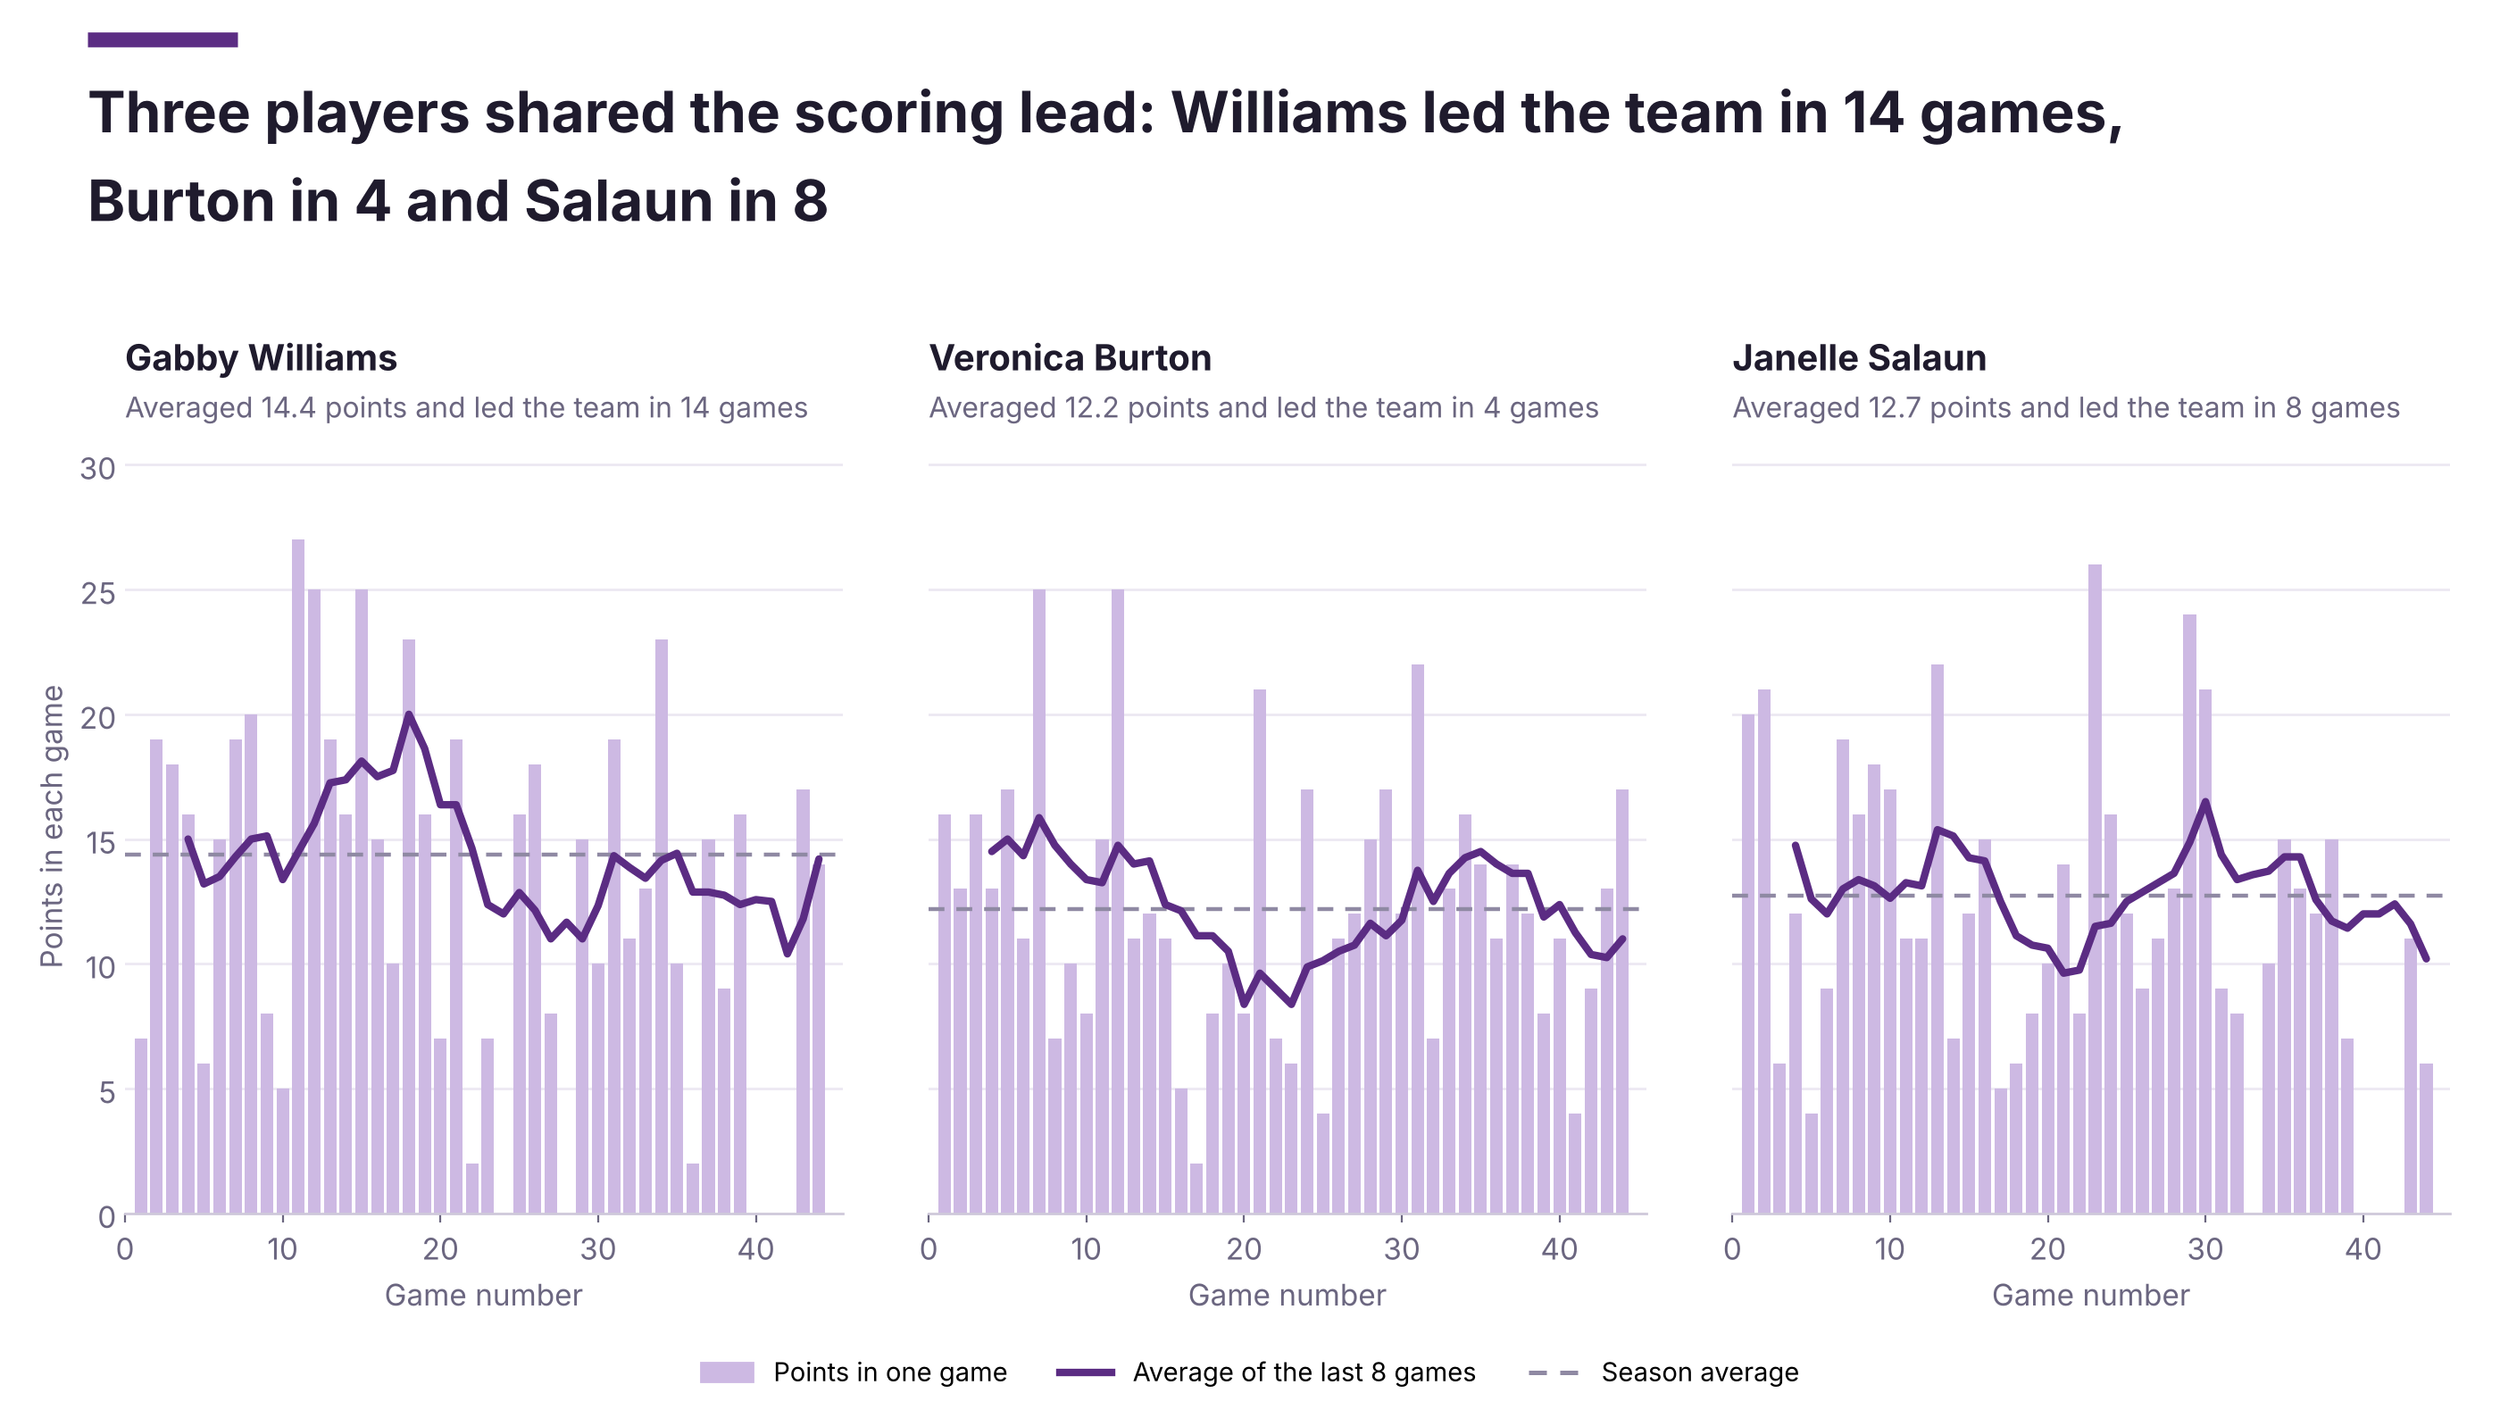
This chart asks whether the offense depended on one scorer. Each panel follows one of the three leading scorers, with light bars for the points she scored in every game, a dark line for her average over the last 8 games, and a dashed line for her season average. Showing every game, not just the average, makes it possible to judge how steady each player was and whether her best games lined up with the others'.
Gabby Williams averaged 14.4 points per game, Janelle Salaun 12.7 and Veronica Burton 12.2, a spread of 2.2 points. Together they scored 39.3 points per game, about 48% of the team's scoring. The scoring lead moved around: Williams led the team in 14 games, Salaun in 8 and Burton in 4, which is 26 of 44 games, and other players led the other 18. Their rolling averages rise and fall at different times, so when one was cold another was often producing.
I looked for the opposite pattern as a test, one star with a few helpers. That would show up as a large gap between first and third and a leader who rarely changes. Neither is present. Because the team played the slowest pace in the league, per-game scoring numbers are lower for everyone, so these averages understate how productive the players were per possession. One thing that stands out is that the leading scorer, Williams, was new to the team in 2026, which suggests the offense was able to bring in a scorer without disrupting its structure.
This matters because shared scoring is what the next two charts try to explain. It also changes how the offense should be evaluated: a team whose scoring is spread across several players is harder to defend and is less exposed to an absence. The limitation is that scoring averages do not show minutes or shot attempts, so the next step is points per minute and shot share for each player, which would show whether the balance came from the roles or from equal opportunity.
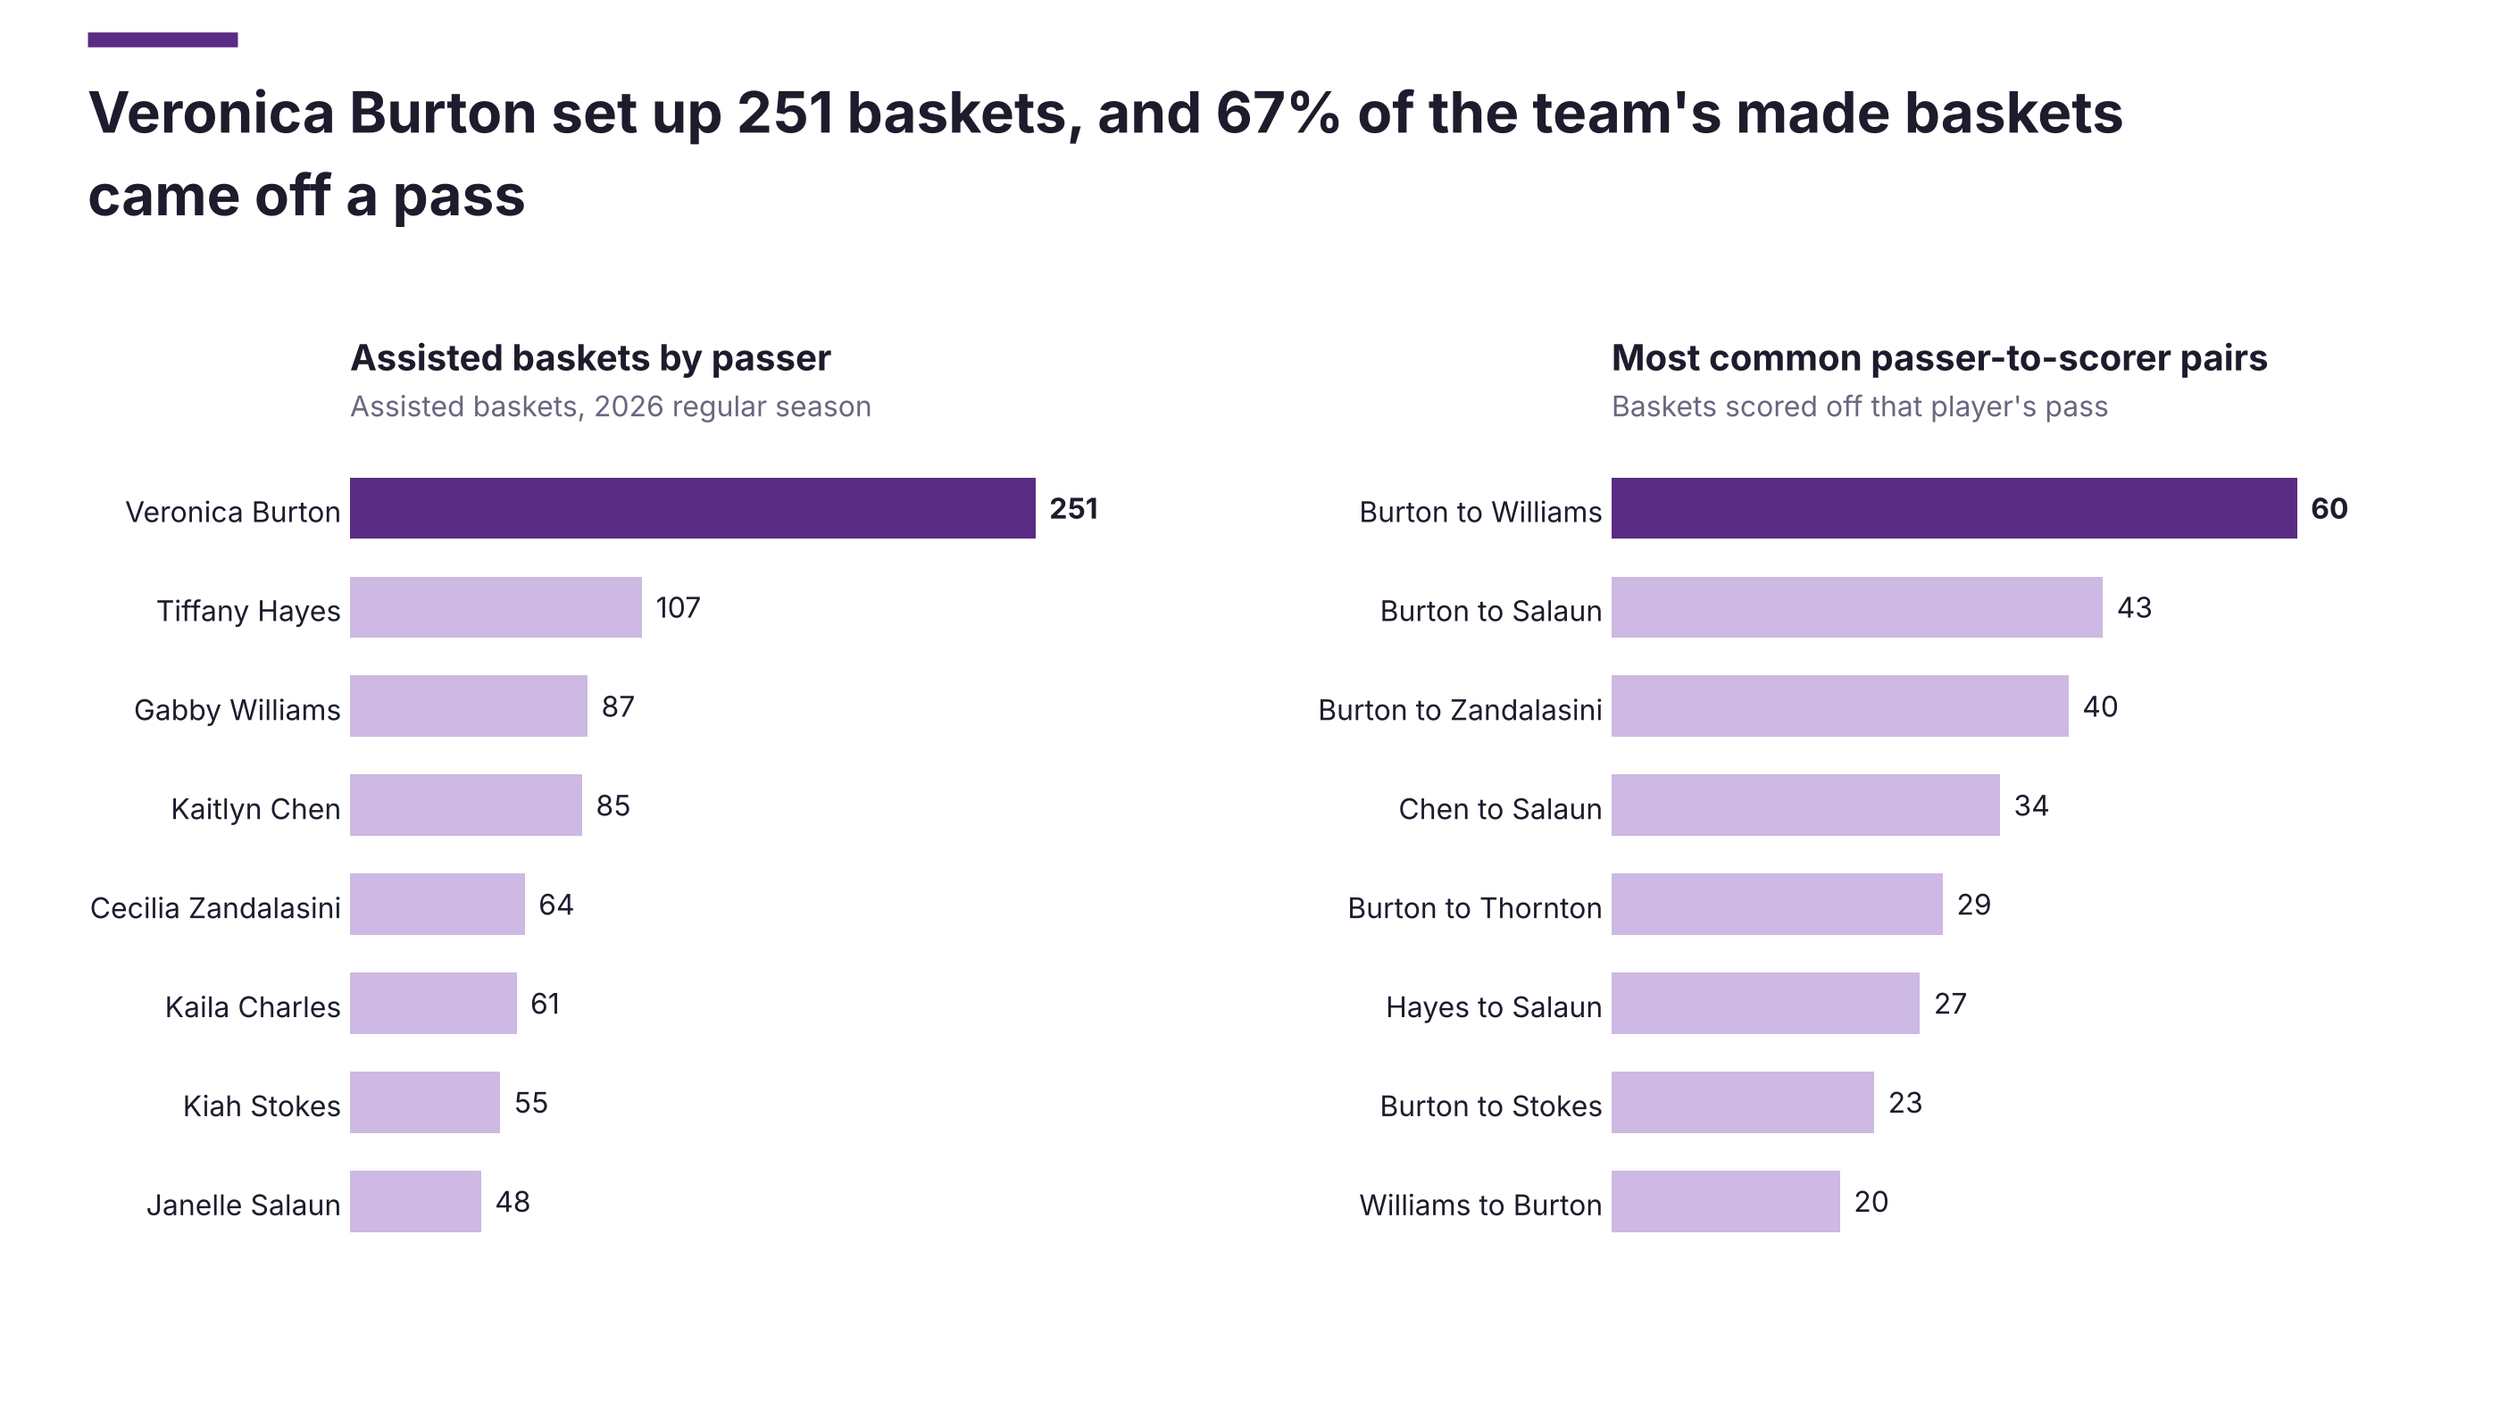
This chart asks how the shared scoring was produced. The left panel ranks players by assists, which are passes that lead directly to a made basket, with Veronica Burton in purple, and the right panel ranks the most common pairs of passer and scorer. Together they show who creates baskets and who finishes them, which a scoring total cannot show.
Burton had 251 assists, more than double the next player, Tiffany Hayes, at 107, and about 5.7 per game. Of the team's 1,262 made baskets, 850 were assisted (67%), and 251 of them, about one in five of all made baskets, came off a Burton pass. Her passes were spread across five scorers: Gabby Williams (60), Janelle Salaun (43), Cecilia Zandalasini (40), Kayla Thornton (29) and Kiah Stokes (23). Those five account for 195 of her 251 assists, about 78%, and no single pairing makes up more than 24% of them.
I checked two ways this could mislead. First, assist totals depend on teammates making the shot, so a high total could mean good finishers and not good passing, which I cannot fully separate. Second, a high concentration in one player is a strength only if she stays available. Burton played all 44 games, so the risk did not appear in 2026, but it is a real dependency: the chart shows how much of the offense would need to be replaced if she missed time.
This matters because it connects the earlier charts into a single explanation. The bench supplied depth, the scoring was shared, and one passer organized it, which is a coherent offensive structure and not a set of separate facts. It also shows what the team needs around her: players who score well off passes. The next test is whether the pairings were stable across the season or whether the roles changed, which would require game-by-game assist data.
PART 3: HEALTH AND DURABILITY
They stayed healthy and stayed together.
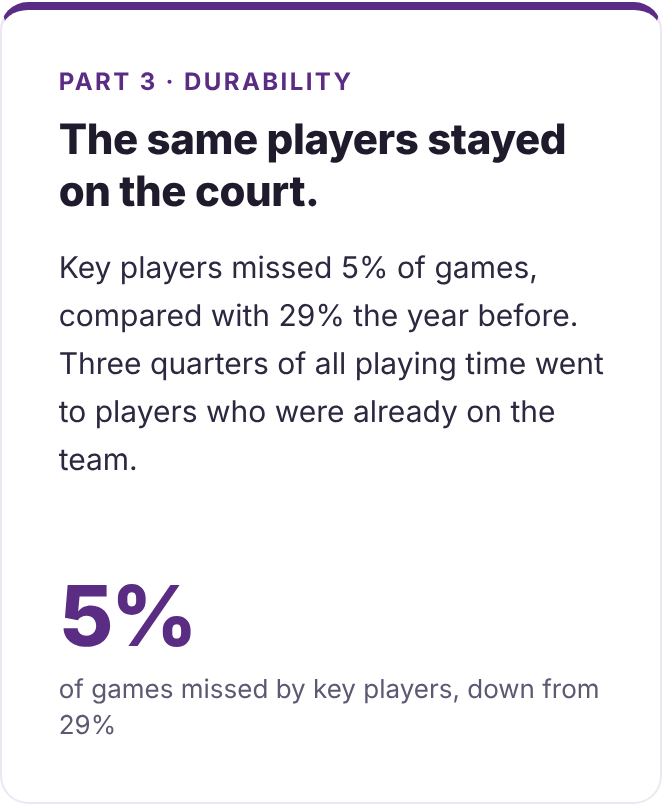
Health and roster stability are easy to overlook, but they show up clearly in the data. In 2025, there was not one game in which all ten key players were available. In 2026, that happened in 29 of 44 games, and key players missed only 5% of games compared with 29% the year before. The team also kept its roster together: 75% of playing time went to players who were already on the team, the second highest share among established teams.
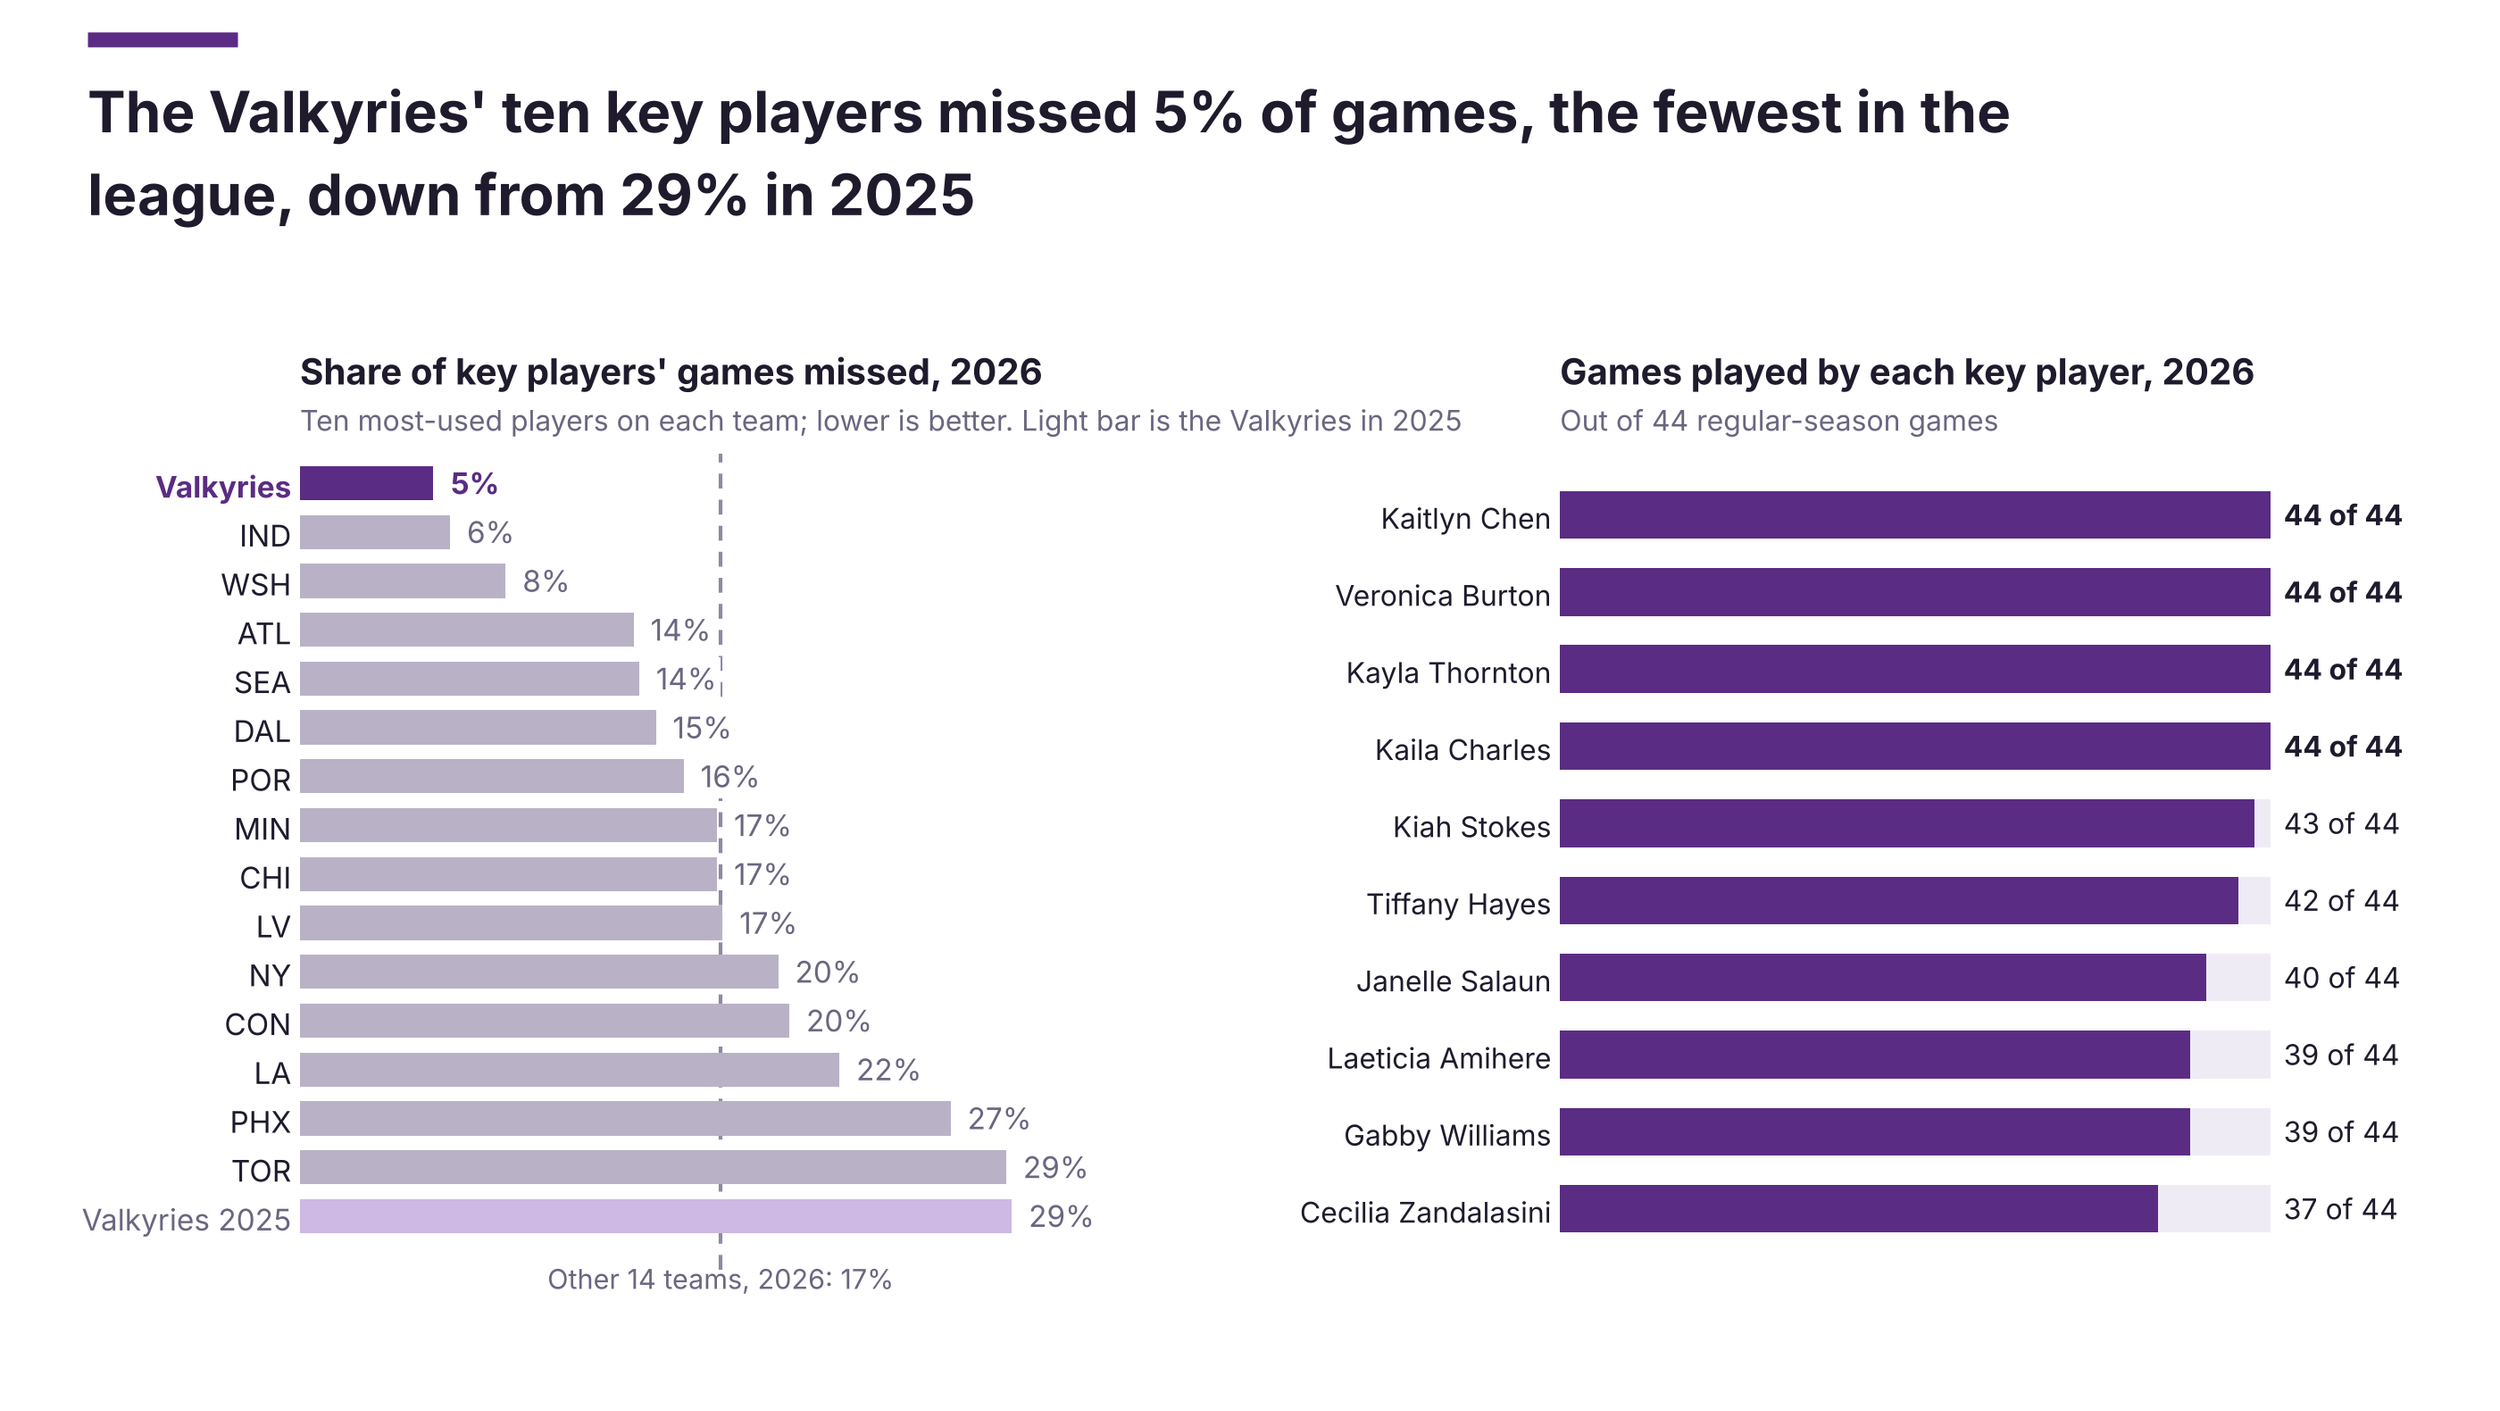
This chart tests the first piece of the durability argument, whether the same players were on the floor together. For each team I identified the ten players with the most minutes, then counted the share of their possible games they missed. The left panel ranks all teams in 2026, with the Valkyries in purple, a dashed line for the other 14 teams and a light purple bar for the Valkyries' own 2025 figure. The right panel lists the Valkyries' ten key players and the number of the 44 games each played.
The Valkyries' key players missed 5% of their possible games, the lowest in the league. Indiana was next at 6% and Washington at 8%, while the other teams averaged 17%. In 2025 the figure was 29%, which ranked 12th. Four players played all 44 games and the lowest was Cecilia Zandalasini with 37. All ten were available in 29 of 44 games in 2026 and in none in 2025.
I wanted to know whether this availability mattered for results. In the 29 games with all ten players, the Valkyries won 23 (79%) with an average margin of plus 7.6 points. In the 15 games with at least one key player missing, they won 9 (60%) with an average margin of plus 5.9. The direction supports the argument, but it is only 15 games, and I did not control for opponent or home and away, so I treat it as supportive and not conclusive.
There is also a measurement caveat. Key players are defined by minutes, so a player who was injured most of the season would not make the list, which makes every team's missed-game rate look lower than the true number. It applies to all teams equally, so the ranking is fair, but the absolute levels are conservative. This matters for the story because availability is the largest change in the data and the one most within a team's control, which makes it the strongest practical lesson for a front office.
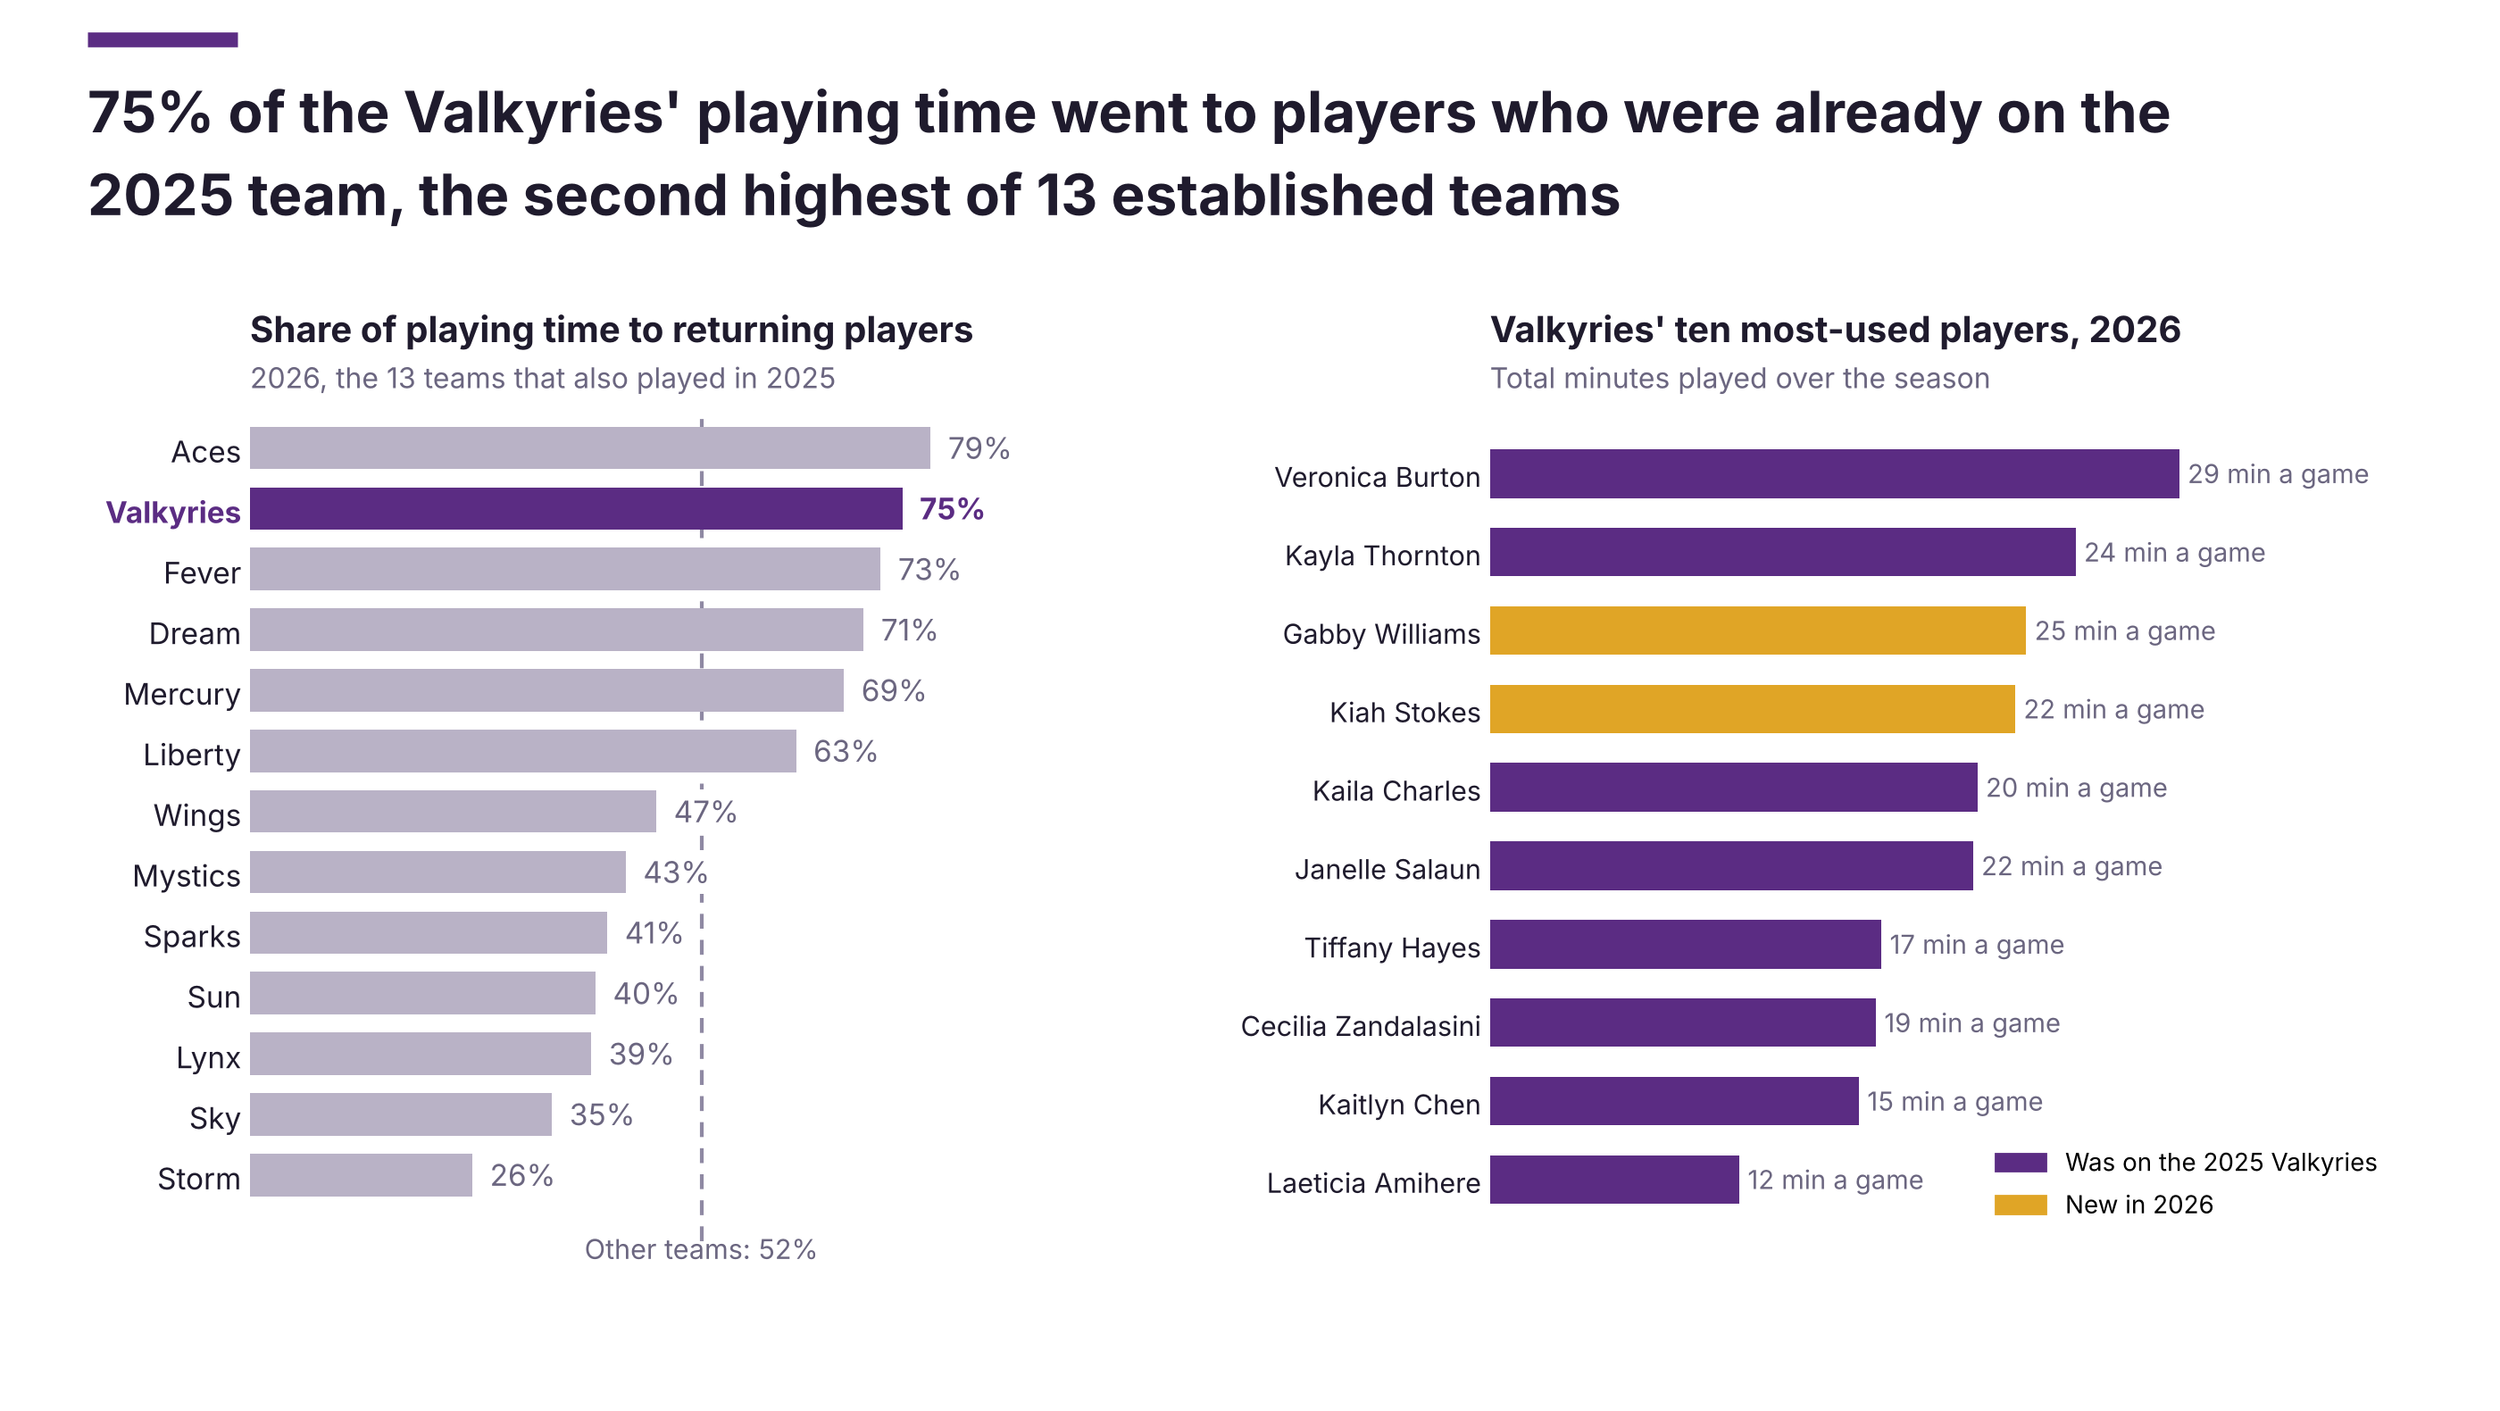
This chart tests the second piece of the durability argument, whether the roster stayed together. The left panel covers the 13 teams that also played in 2025, and each bar is the share of a team's 2026 playing time that went to players who were already on that team in 2025. The right panel shows the Valkyries' ten most-used players by minutes, with players who joined in 2026 in gold. Measuring minutes and not roster spots matters, because a roster can keep many names while the real rotation changes.
The Valkyries gave 75% of their playing time to returning players. Only the Aces were higher, at 79%, and the other established teams averaged 52%. Eight players returned, and two newcomers, Gabby Williams and Kiah Stokes, played about 22% of the minutes together and were among the ten most-used players.
I looked at the same question from the 2025 side. Players who returned accounted for about 57% of the 2025 minutes, and players who left accounted for 43%. In 2026 the returning players' share rose to 75%. That means the team lost a large part of its 2025 rotation but concentrated its minutes in the players who stayed, and the newcomers who played a lot were few. The roster turned over, but the rotation did not.
This matters because it separates two things that are easy to confuse, a stable roster and a stable rotation. Combined with the availability chart, it shows that the group on the floor was both healthy and familiar, which is the condition under which lower turnovers and shared scoring become plausible. The limit is that I cannot tell whether the returning players improved or the newcomers made the difference, since that needs player-level comparisons across seasons.
THE OVERALL SEASON
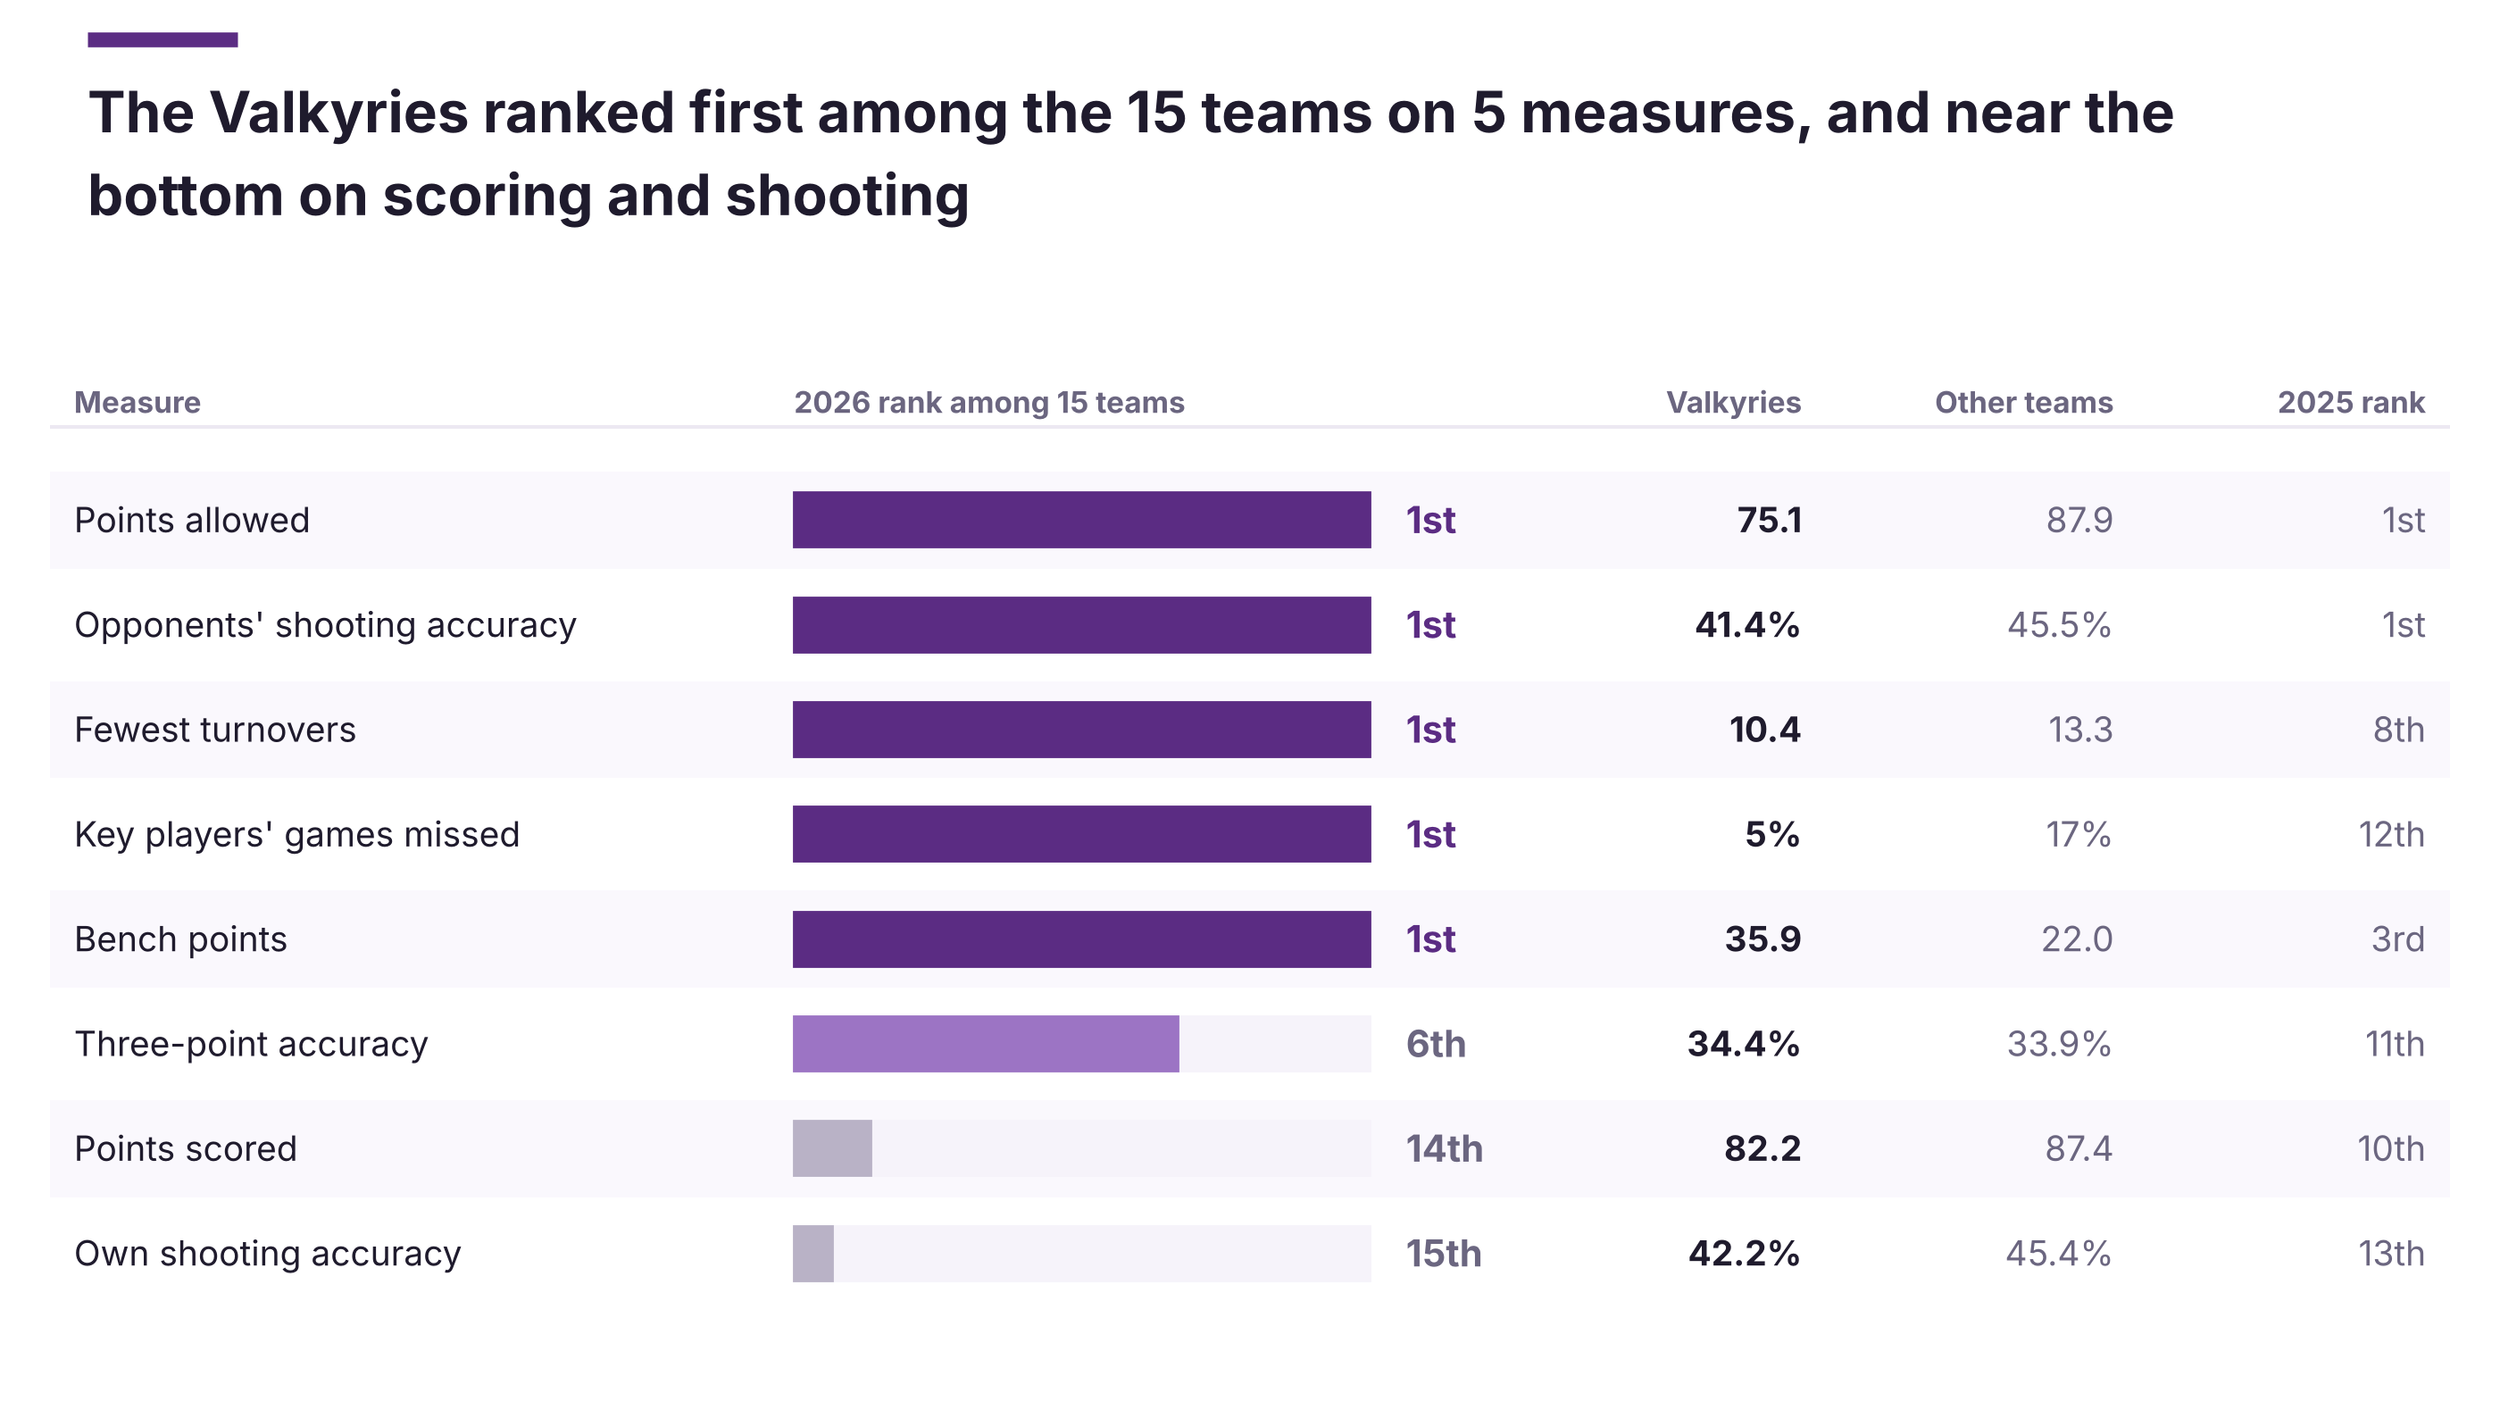
Each row is a measure, and the bar is the Valkyries' 2026 rank among 15 teams, with a longer bar for a better rank. The columns on the right give the Valkyries' value, the average of the other teams and their 2025 rank. I put the weak measures next to the strong ones on purpose, because a case study that shows only strengths is not credible.
The Valkyries ranked first on five measures: points allowed (75.1 compared with 87.9), opponents' shooting accuracy (41.4% compared with 45.5%), turnovers (10.4 compared with 13.3), key players' games missed (5% compared with 17%) and bench points (35.9 compared with 22.0). They ranked 6th in three-point accuracy, 14th in points scored and 15th in their own shooting accuracy. The largest jumps in rank were in games missed, from 12th to 1st, and turnovers, from 8th to 1st.
Two of these rows need a careful reading. Points scored ranks 14th, but per 100 possessions the offense was average, 7th at 104.6 compared with 104.8, because the team played the slowest pace. So the weakness is smaller than the table suggests. The own-shooting-accuracy rank of 15th is a real weakness, and it fits with a team that was strong on turnovers and depth and weaker at making shots.
This matters because it summarizes the argument and shows where it could be wrong. The strengths line up with the three parts of the story, defense, shared work and durability, and the weaknesses are concentrated in shooting. For a decision-maker, the practical reading is to protect the strengths, which depend on staying healthy, and to look for shooting.
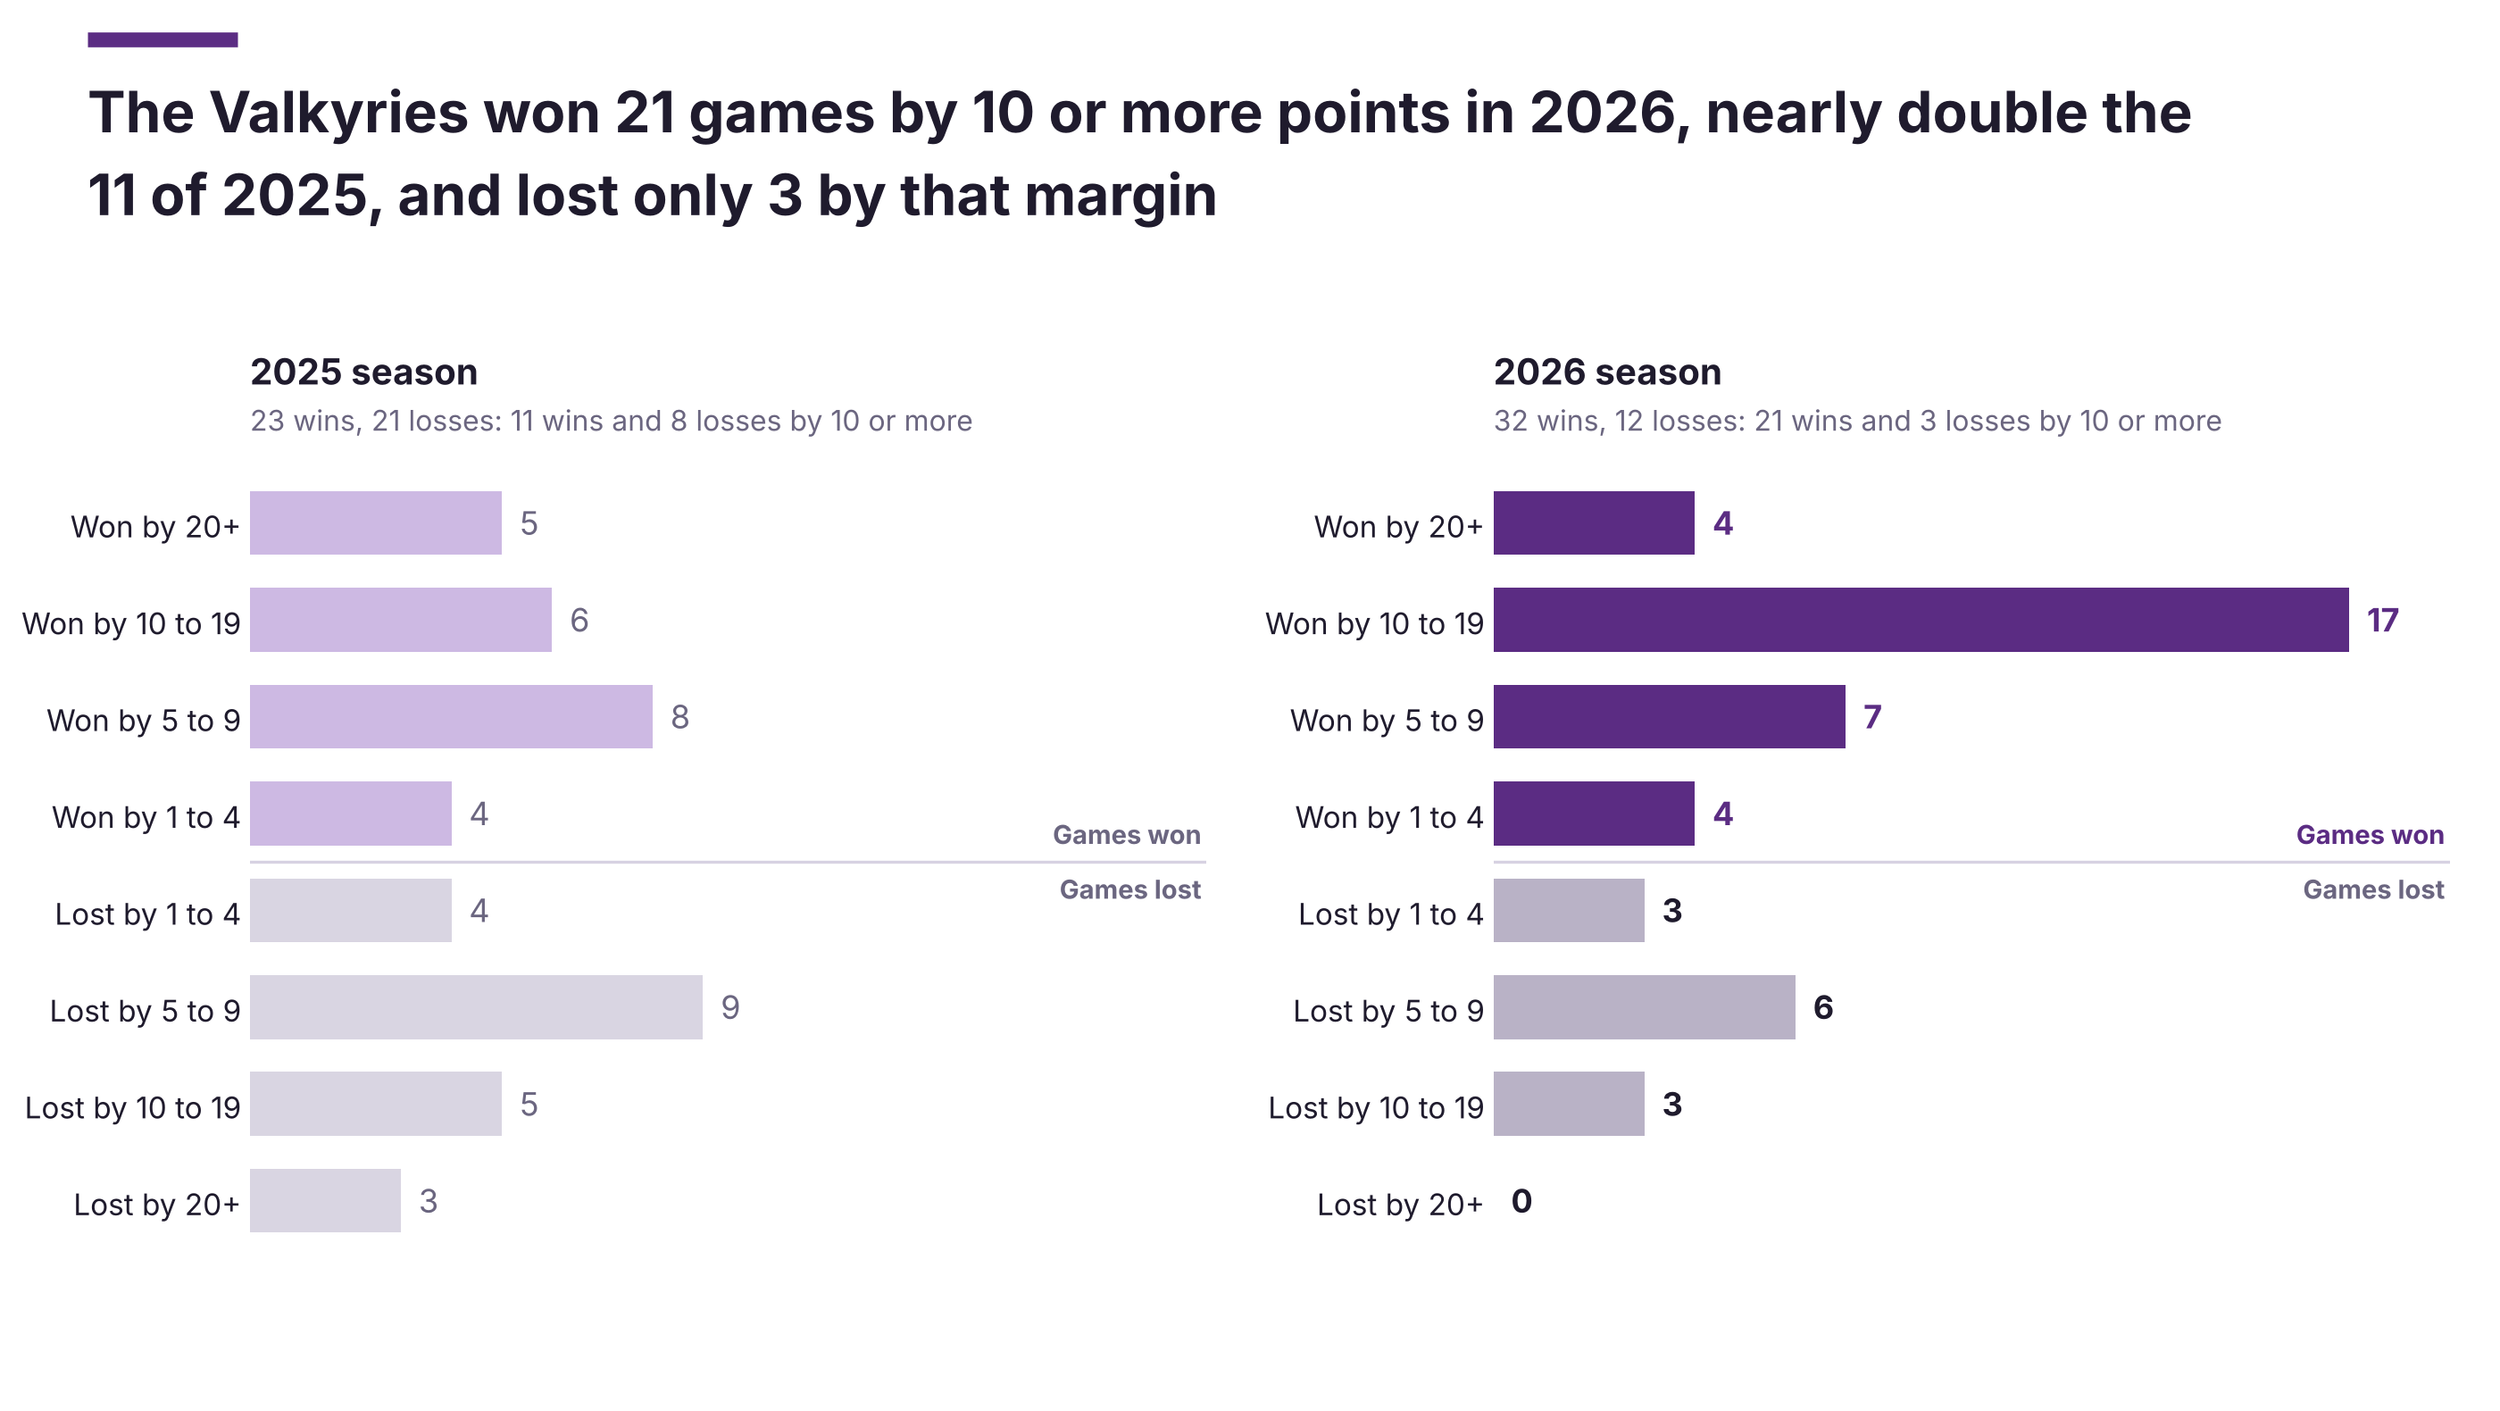
This chart compares how the Valkyries' games ended in 2025 and 2026. Each row is a group of final margins, from won by 20 or more at the top to lost by 20 or more at the bottom, and each bar counts the games in that group. The 2025 season is on the left and 2026 on the right, on the same scale. I grouped games by margin because it shows how the extra wins were earned, which a win total alone cannot show.
Wins by 10 or more points rose from 11 to 21, wins in closer games slipped from 12 to 11, and the two changes net to the 9 extra wins. Losses by 10 or more fell from 8 to 3. The record in games decided by 10 or more went from 11-8 to 21-3, while the record in games decided by fewer than 10 was 12-13 and then 11-9. So the improvement is in games the team controlled, and the question is what changed on the court to produce that.
I answered it by reasoning from the average margin, which rose from plus 1.4 points per game to plus 7.0. The first split is offense against defense, and the raw numbers point to offense: points scored rose by 4.4 per game and points allowed fell by only 1.2. I did not stop there, because two things could make that split misleading. The first is pace. The Valkyries played 78.4 possessions per game in both seasons, so the extra scoring is not the result of playing faster. The second is the league. Average scoring per 100 possessions rose from 101.0 to 104.8 between the seasons, so a team that scored more may only have kept up. Measured against the league average, the Valkyries' offense went from 2.2 points per 100 possessions below average to 0.1 below, a gain of 2.1. Their defense went from 3.3 below the league average to 8.8 below it, a gain of 5.5. The total is 7.6 points per 100 possessions, and the defense accounts for about 72% of it. The raw view and the league-adjusted view disagree, and the adjusted view is the one that compares like with like, so I use it. Their defense ranked 3rd in 2025 and 1st in 2026, and their offense moved from 9th to 7th.
The next question is what the defense actually did differently, and the shot data rules out the obvious answer. Opponents' effective shooting percentage was 47.2% in 2025 and 47.8% in 2026, which did not improve, although the league as a whole rose from 50.0% to 51.5%. What changed was how many shots opponents got. They turned the ball over 640 times in 2026 compared with 562 in 2025, 78 more, and they grabbed fewer offensive rebounds, 346 compared with 370. Steals rose from 6.8 to 7.8 per game and blocks from 2.9 to 4.0. Opponents therefore took fewer shots per possession, 0.804 compared with 0.843, and that alone is worth 3.7 points per 100 possessions. They made up part of it with more free throws and slightly better shooting, which is why the raw defensive gain looks small.
The offense shows the same mechanism. The Valkyries turned the ball over 505 times in 2026 compared with 623 in 2025, 118 fewer, and recovered more offensive rebounds, 400 compared with 384. They took 0.866 shots per possession compared with 0.828, worth 3.7 points per 100 possessions. Better shooting added another 3.0 as their effective shooting percentage rose from 48.2% to 49.9%, and fewer free throws took away 0.9. Adding the two sides, the team's turnover difference went from 61 worse than opponents to 135 better, a swing of 196 possessions, or about 4.5 per game. At roughly one point per possession that is on the order of 4 points per game, which is most of the 5.7-point improvement in average margin.
That is the reasoning behind the margin chart. Controlling turnovers on both sides gave the team more possessions that ended in a shot and its opponents fewer. That advantage compounds across a game, which is why it appears as a move from close games into 10-point games and not as a few extra close wins. The limits are that this identifies what changed and not why the turnovers changed. Roster continuity, depth and availability fit the timing, and the 29 games with all ten key players averaged a plus 7.6 margin compared with plus 5.9 in the other 15, but the 2025 team was also in its first season. The tests that would separate these are whether the turnover rate improved in the games the key players missed, and whether the same players had fewer turnovers across the two seasons. A schedule-adjusted margin would also check that the 2026 pattern holds against strong opponents.