Starbucks Ordering Patterns
Data Science Project
A data analysis project using SQL and Tableau to explore how Starbucks customer ordering patterns, demographics, loyalty, and product choices influence revenue and customer behavior.
Project Context
Starbucks is a brand almost everyone recognizes, and for many people, it is part of their everyday routine — a morning coffee before work, a quick mobile order between classes, a drive-thru stop during a commute, or a place to sit and study. Because Starbucks is so familiar, this dataset felt like a meaningful way to analyze customer behavior through something people already understand.
For our team, the project was interesting because a Starbucks order can reveal more than just a drink choice. It can show how customers prefer to order, which age groups are most active, whether rewards membership influences spending, how food add-ons affect order value, and how customization connects to both revenue and fulfillment time.
Instead of looking at Starbucks only as a coffee brand, we treated it as a customer behavior dataset. By cleaning and normalizing 100,000 transactions, then analyzing them with SQL and Tableau, we explored how everyday ordering habits can turn into useful business insights around digital ordering, loyalty, product strategy, and customer experience.
Problem Statement
Starbucks has access to large amounts of customer ordering data, but the challenge is understanding which customer behaviors, ordering channels, and product choices have the strongest impact on revenue and customer experience.
For this project, our team analyzed 100,000 Starbucks transactions to identify how factors such as age group, mobile ordering, rewards membership, drink category, food add-ons, and customization influence spending, order volume, fulfillment time, and satisfaction.
Dataset & Data Preparation
About Dataset:
Source: Kaggle
Link: https://www.kaggle.com/datasets/likithagedipudi/starbucks-customer-ordering-patterns
Records: 100,000 customer transactions
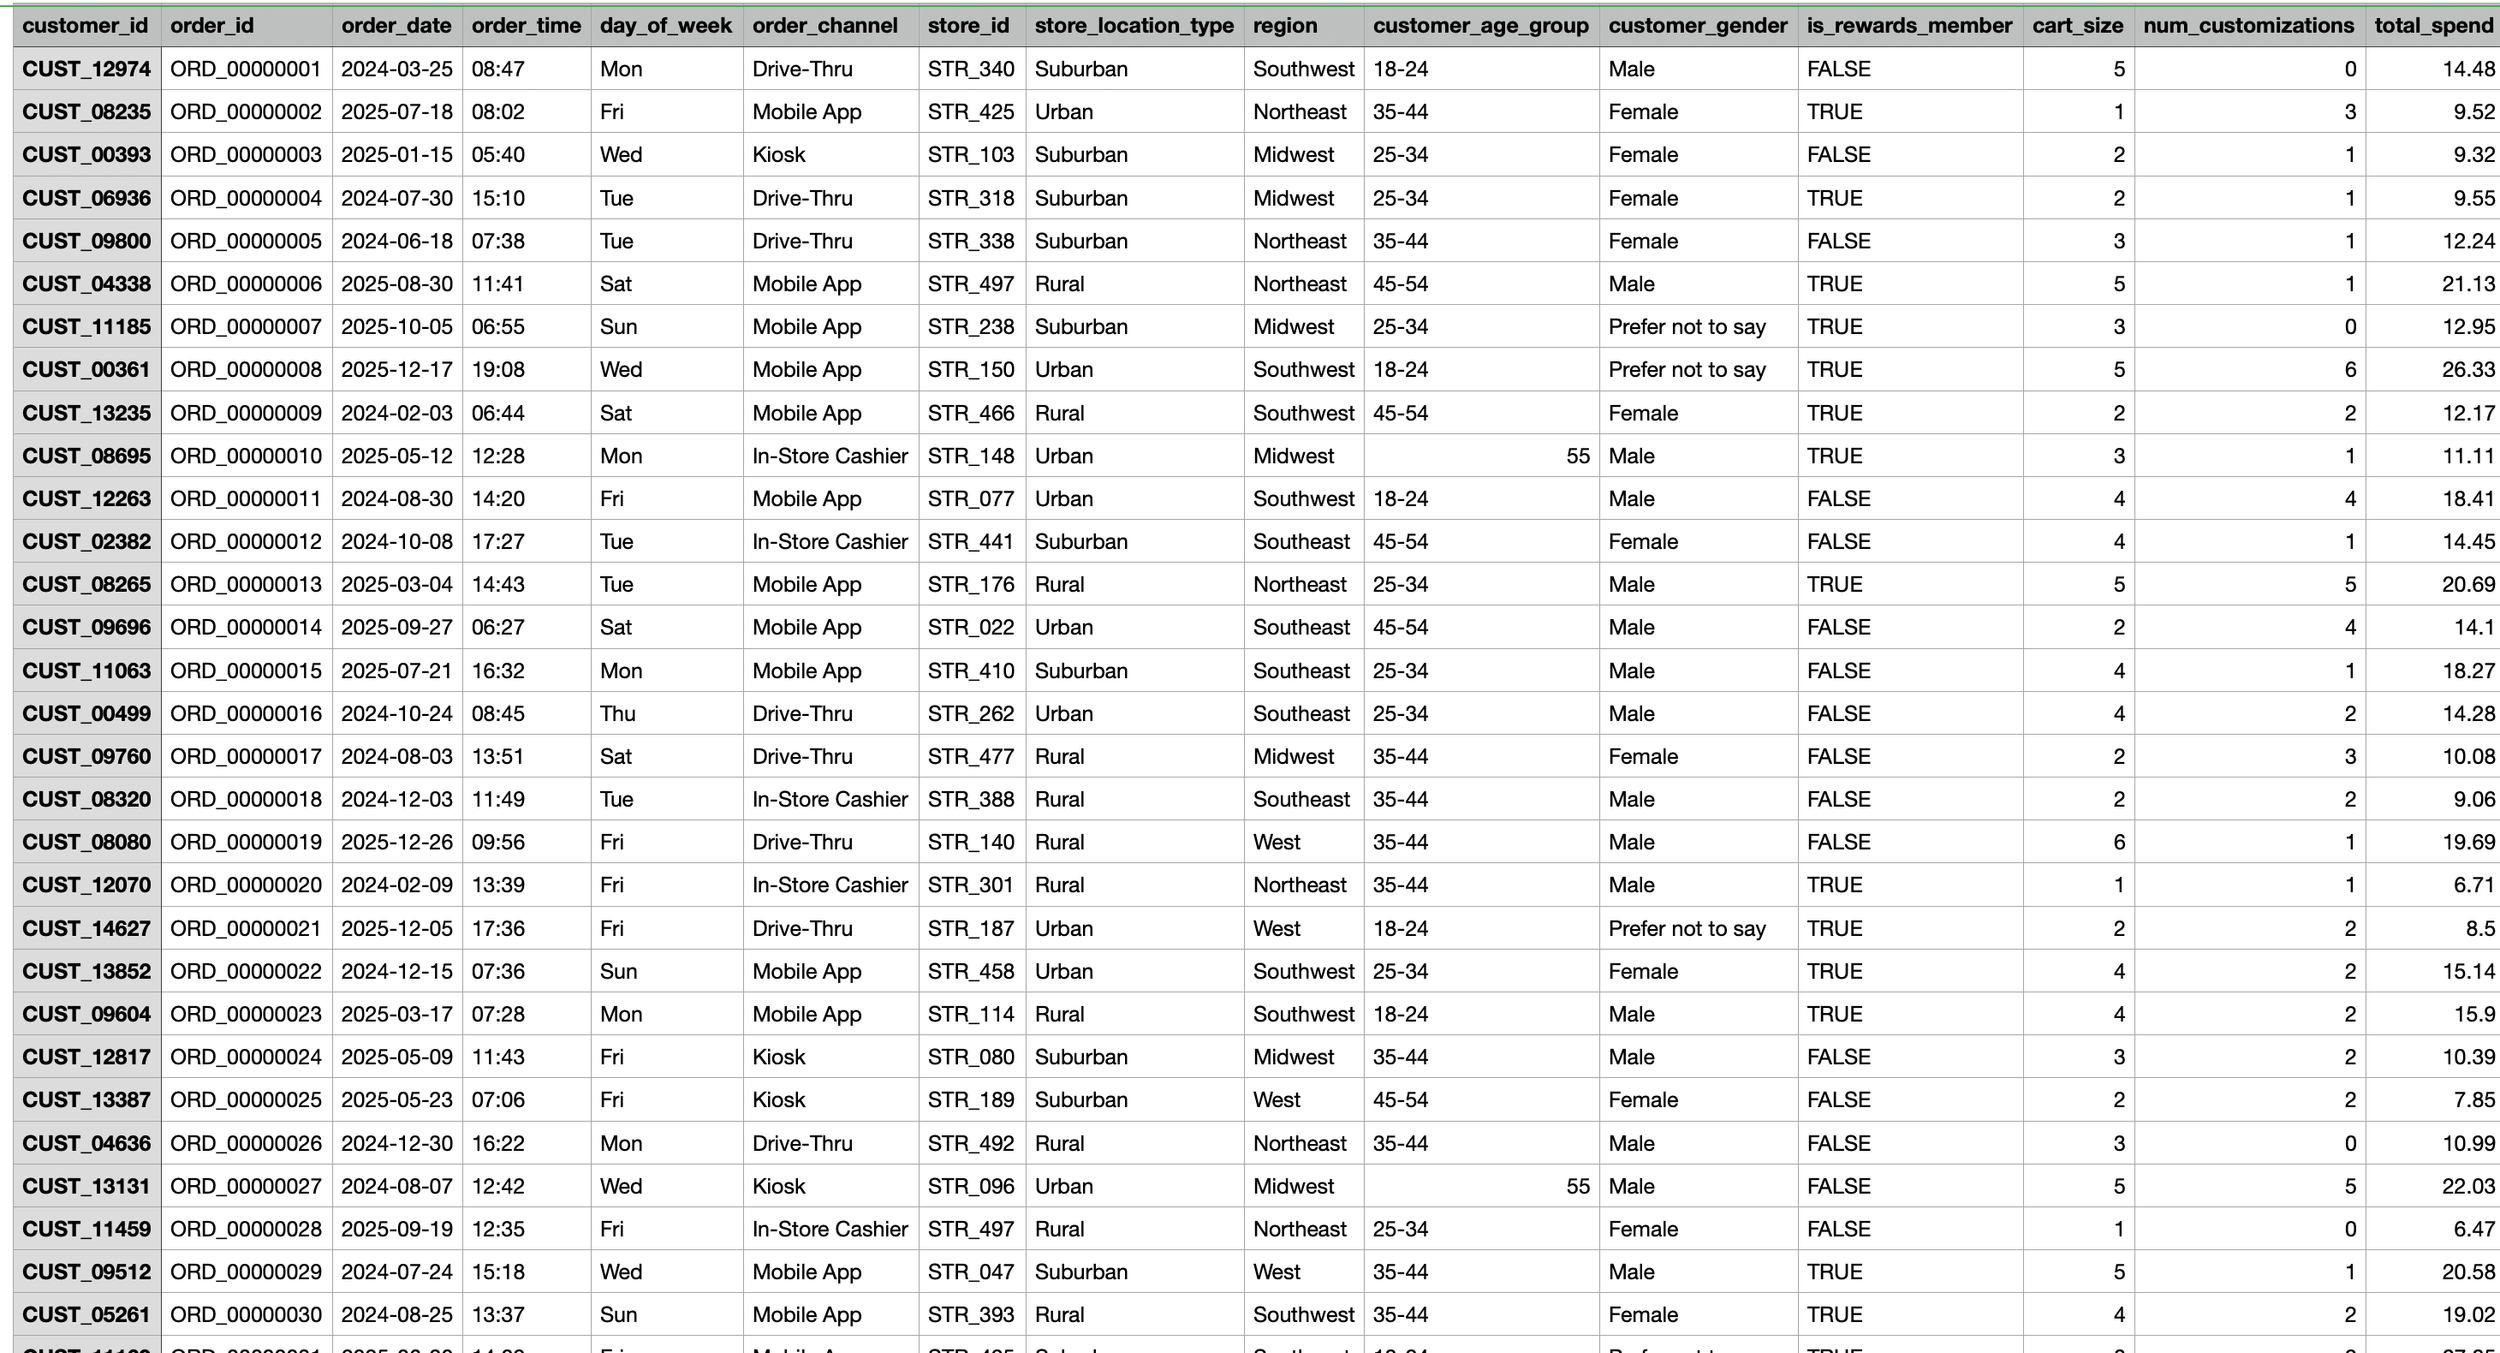
This dataset contains customer transaction records from Starbucks, with each row representing an individual order. It includes information about customer demographics, store location, order channel, drink category, rewards membership, food purchases, customizations, total spend, fulfillment time, and customer satisfaction.
Data Cleaning
Before analyzing the Starbucks customer ordering dataset, our team cleaned and normalized the raw Kaggle CSV file in a Jupyter notebook to prepare it for SQL analysis and Tableau visualizations. Since the dataset originally came as one large flat file with 100,000 rows and 20 columns, the cleaning process restructured the data into a relational format and resolved inconsistencies before importing it into MySQL.
Profiling: We began by profiling the raw data in pandas to check for missing values, duplicate rows, inconsistent categorical labels, and impossible numeric values. The dataset was structurally clean — no nulls, no duplicate order_ids, and all categorical fields (gender, region, drink category, etc.) used consistent labels.
Type conversions: We standardized the order_date column to a consistent MM-DD-YYYY format and converted order_time from HH:MM to HH:MM:SS so MySQL would recognize it as a proper TIME value. Boolean fields (is_rewards_member, has_food_item, order_ahead) were kept as TRUE/FALSE text for readability.
Normalization: We split the single flat table into five normalized tables to eliminate redundancy and follow relational database best practices:
- drink_categories — lookup table with 6 unique drink types and auto-generated IDs
- order_channels — lookup table with 4 unique channels (Mobile App, Drive-Thru, In-Store Cashier, Kiosk)
- customers — one row per customer (~15,000 unique customers) with their demographic attributes
-stores — one row per store (500 unique stores) with location type and region
-orders — the fact table with 100,000 rows, where text columns were replaced with foreign key IDs referencing the lookup and dimension tables.
Validation: Before exporting, we ran integrity checks in pandas to confirm that every foreign key in orders resolved to an existing row in its parent table (no orphaned references) and that all primary keys were unique.
Database Schema + Database Creation in MySQL
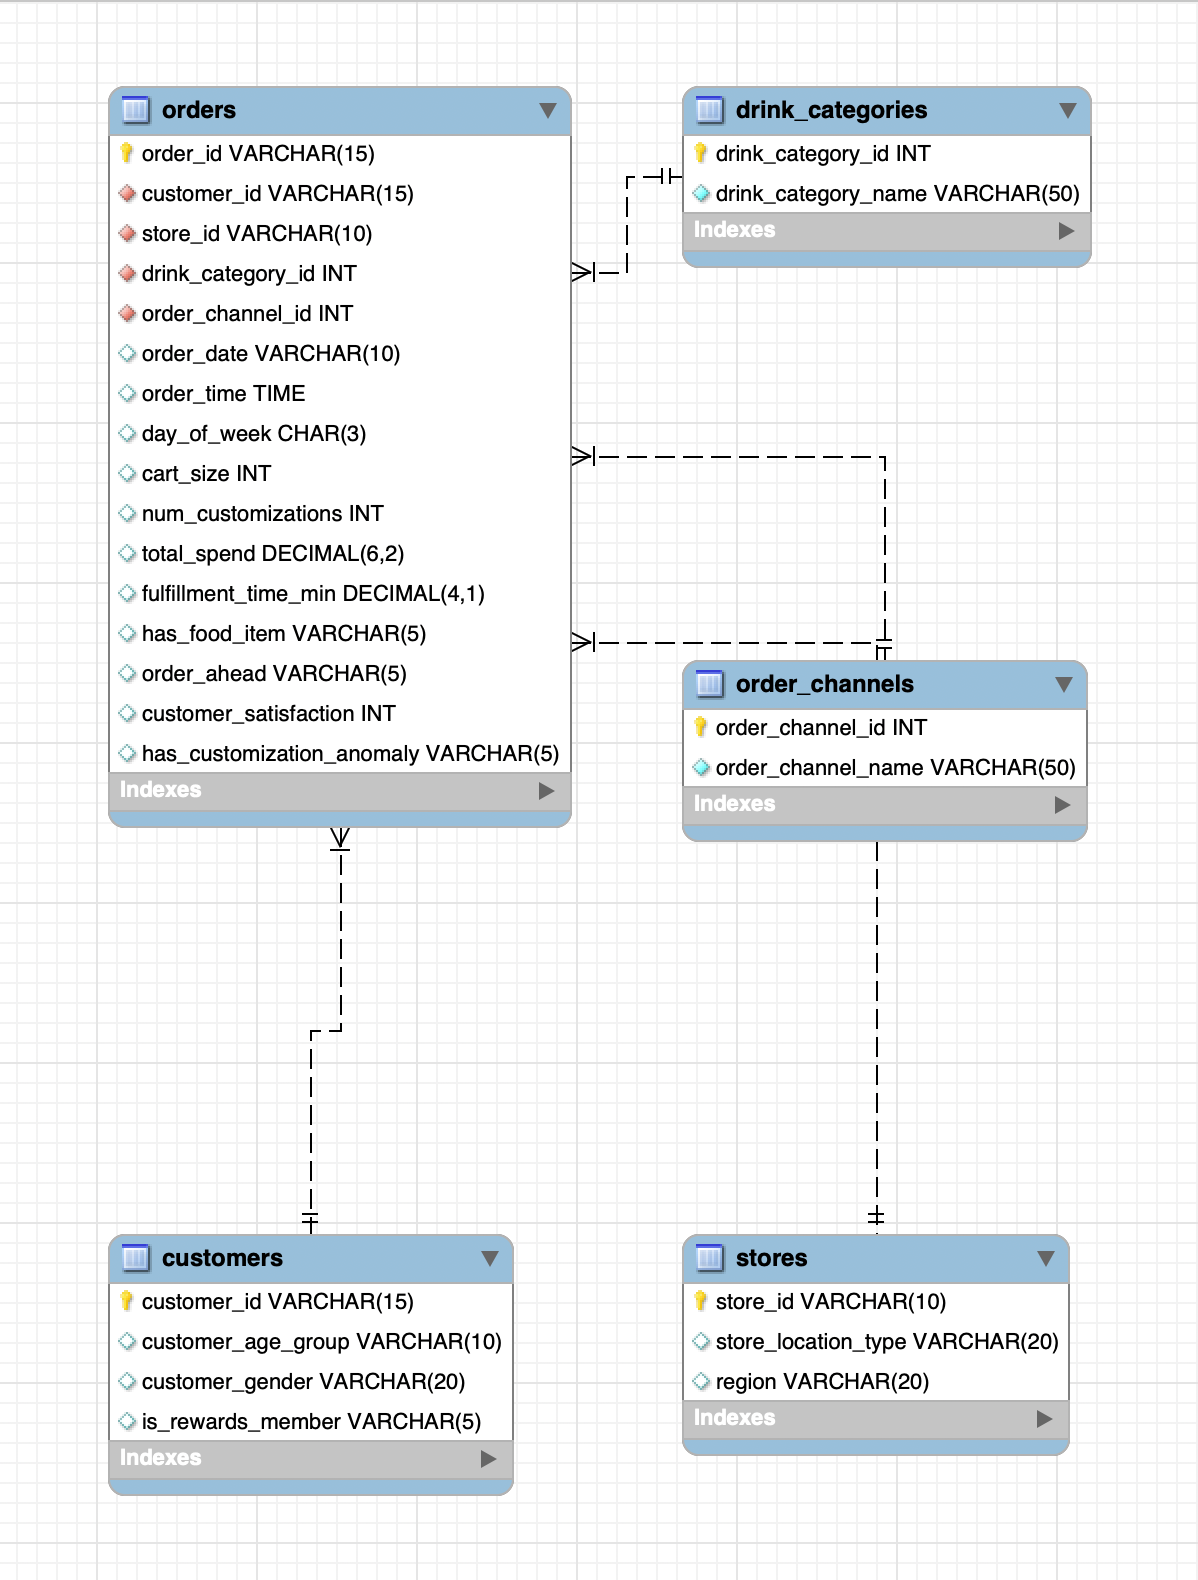
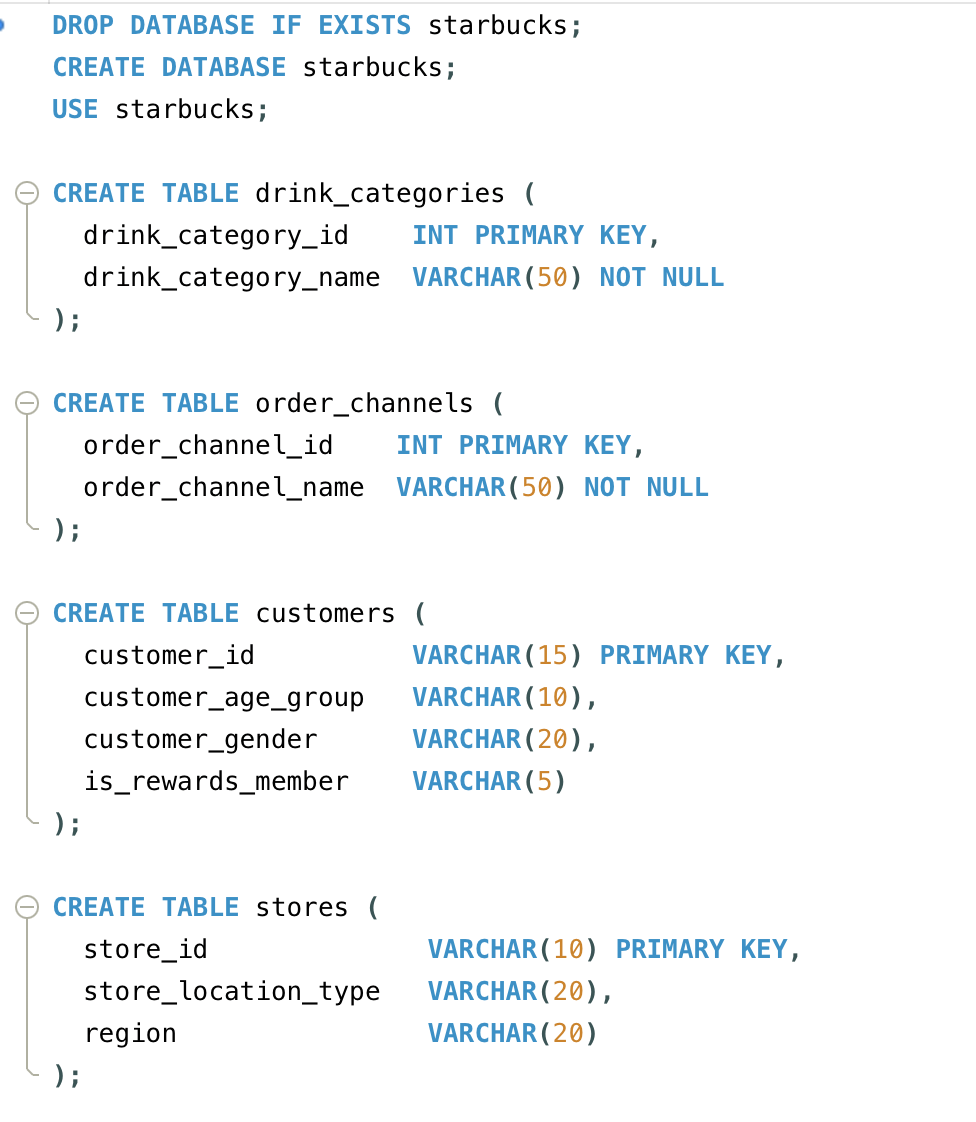
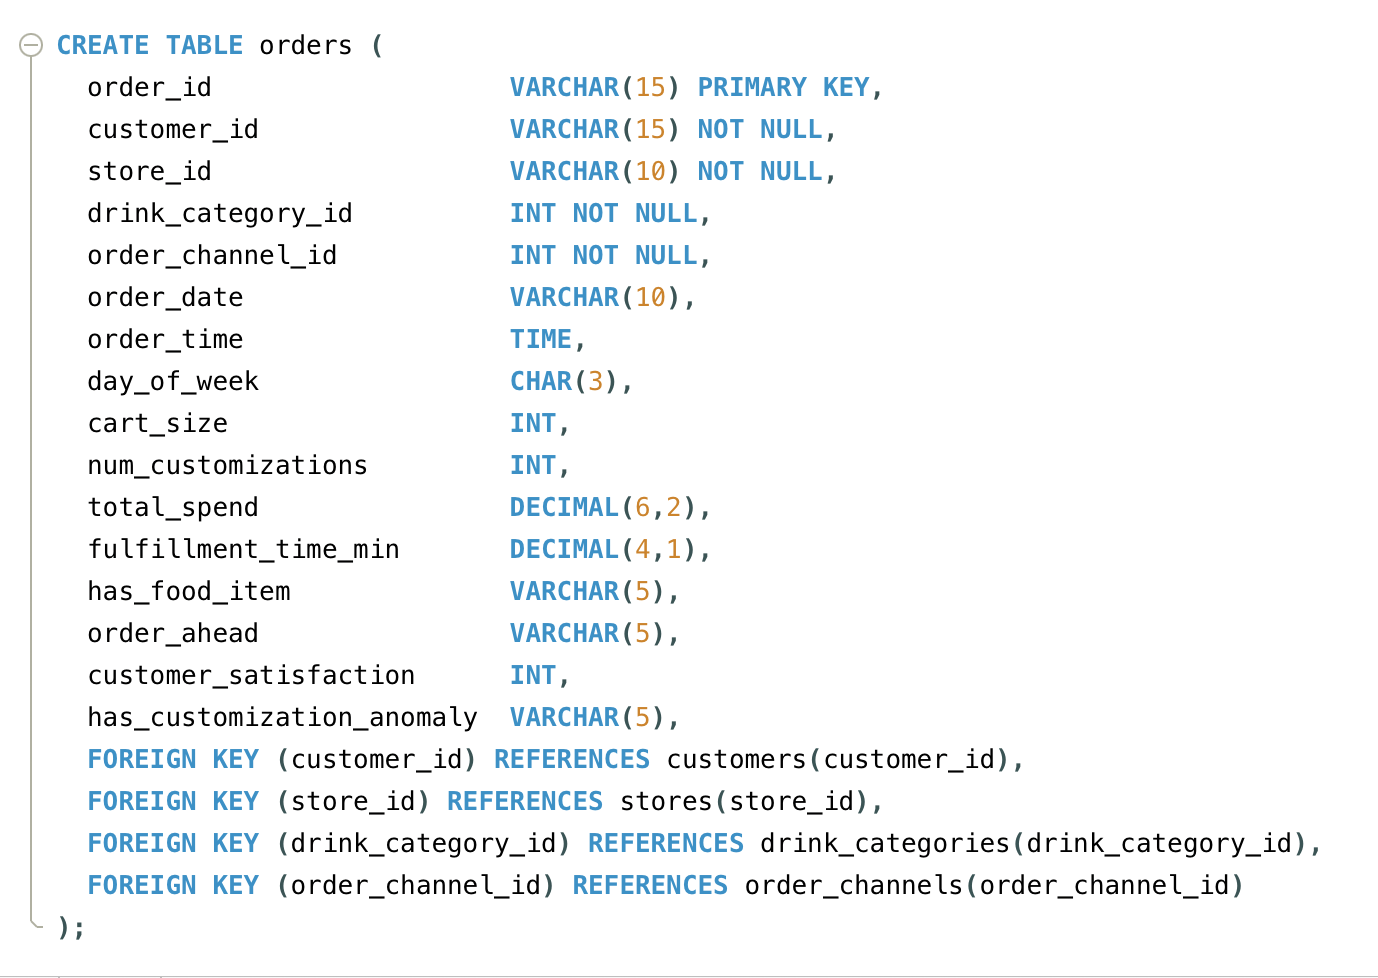
The dataset is organized into five related tables in MySQL: one central fact table that stores every order, surrounded by four lookup tables that describe the customers, stores, drink categories, and order channels involved in those orders.
-orders: the main table, with one row per transaction (100,000 total). It stores the measurable details of each order: total spend, cart size, fulfillment time, customer satisfaction, and timestamps.
-customers: demographic attributes for ~15,000 unique customers (age group, gender, rewards status)
-stores: location type and region for 500 stores
-drink_categories: the six beverage categories sold (Brewed Coffee, Espresso, Frappuccino, Refresher, Tea, Other)
-order_channels: the four ways customers placed orders (Mobile App, Drive-Thru, In-Store Cashier, Kiosk)
Queries
Basic Queries
Query 1: Which ordering channel is the most popular, and how much revenue does each one bring in?
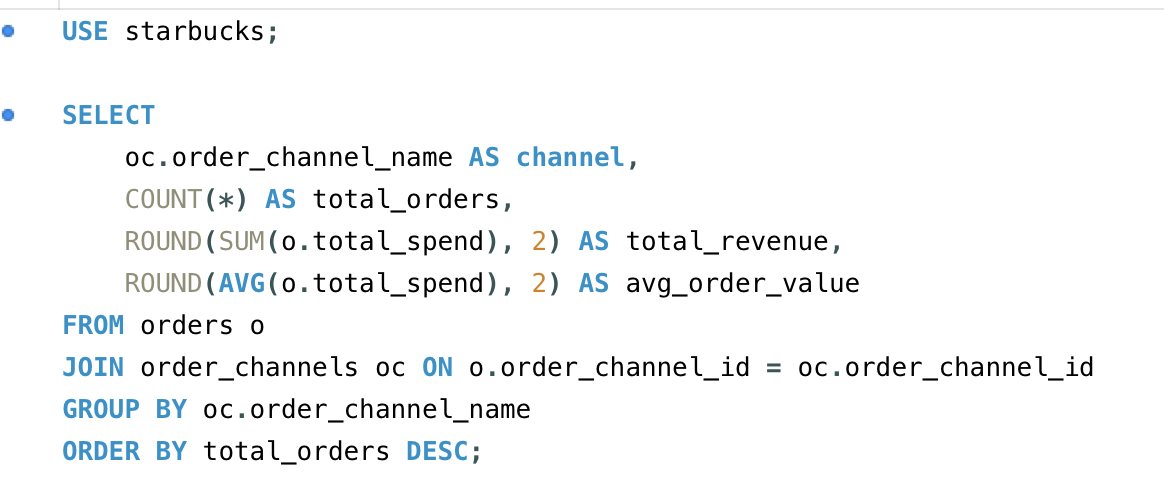
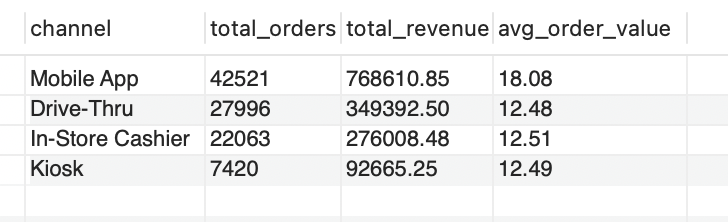
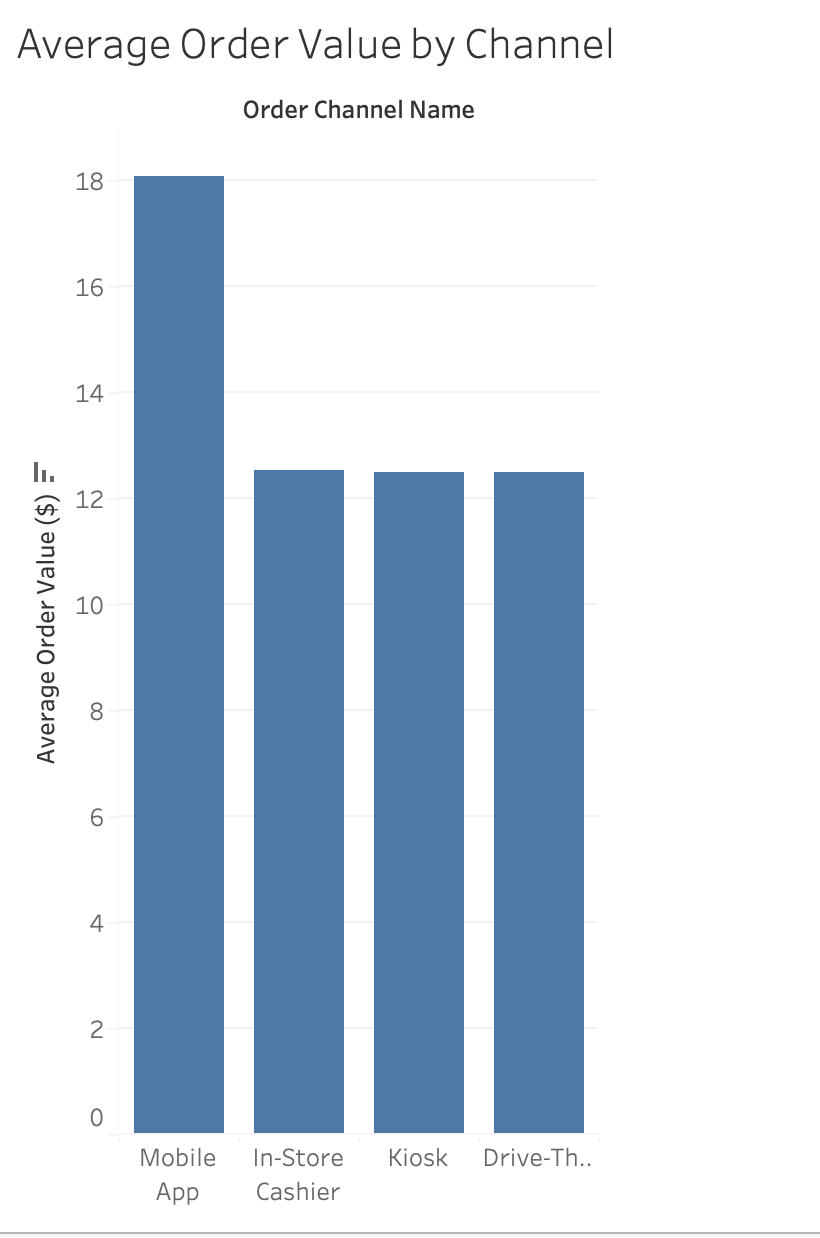
Analysis: To understand how ordering behavior differs across customer touchpoints, I analyzed each ordering channel by total order volume, total revenue, and average order value. This allowed me to compare not only which channels customers use most often, but also which channels generate the highest-value transactions.
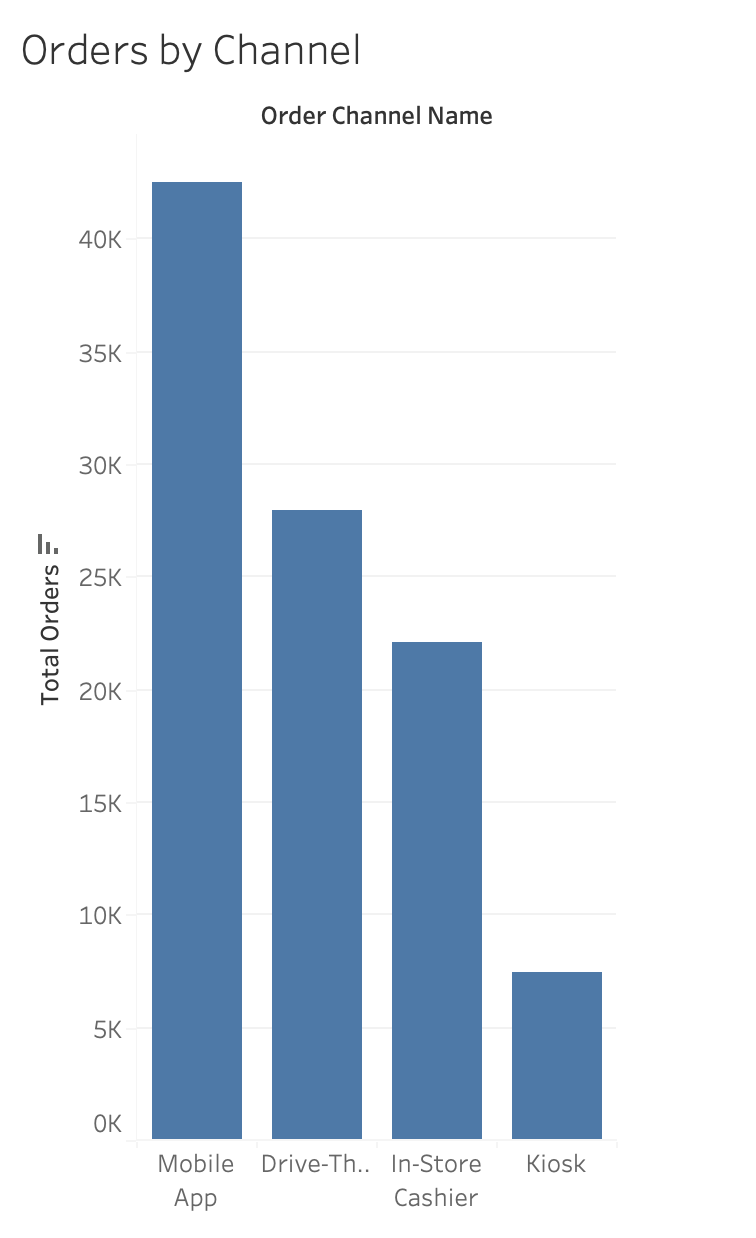
The Mobile App is the strongest-performing channel across every metric. It accounts for 42,521 orders and generates $768,610.85 in revenue, making it the highest-volume and highest-revenue channel in the dataset. Its average order value is $18.08, which is substantially higher than the other ordering channels.
In contrast, Drive-Thru, In-Store Cashier, and Kiosk all cluster around a much lower average order value of approximately $12.50. This gap suggests that Mobile App customers are not simply using a different ordering method — they may be engaging in a different purchasing behavior altogether.
The Mobile App likely supports larger purchases because the digital experience gives customers more time and flexibility to browse the menu, customize drinks, add food items, and respond to rewards or promotional prompts. Unlike Drive-Thru or In-Store Cashier interactions, which are often speed-driven, the app experience may reduce decision pressure and encourage customers to build larger carts before checkout.
Query 2: Do different age groups spend differently per order?
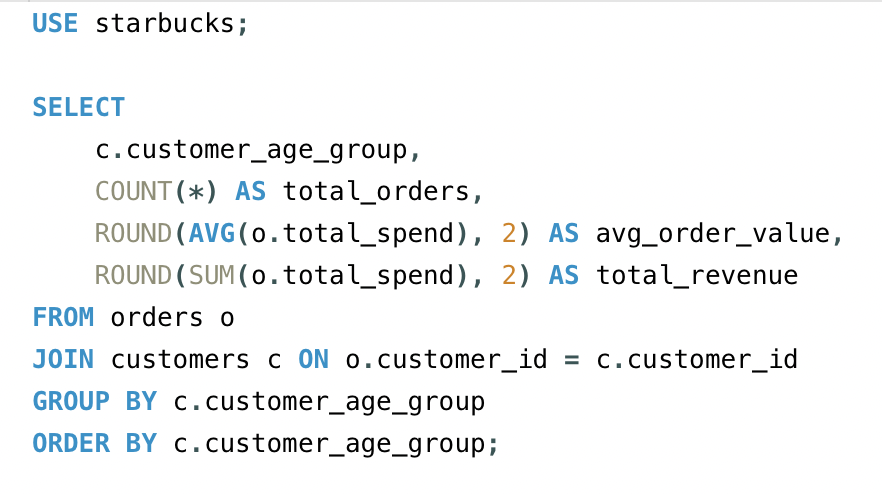
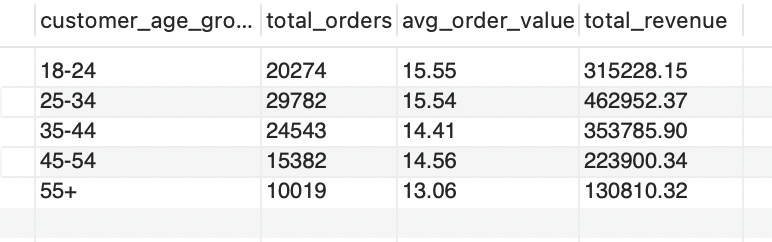
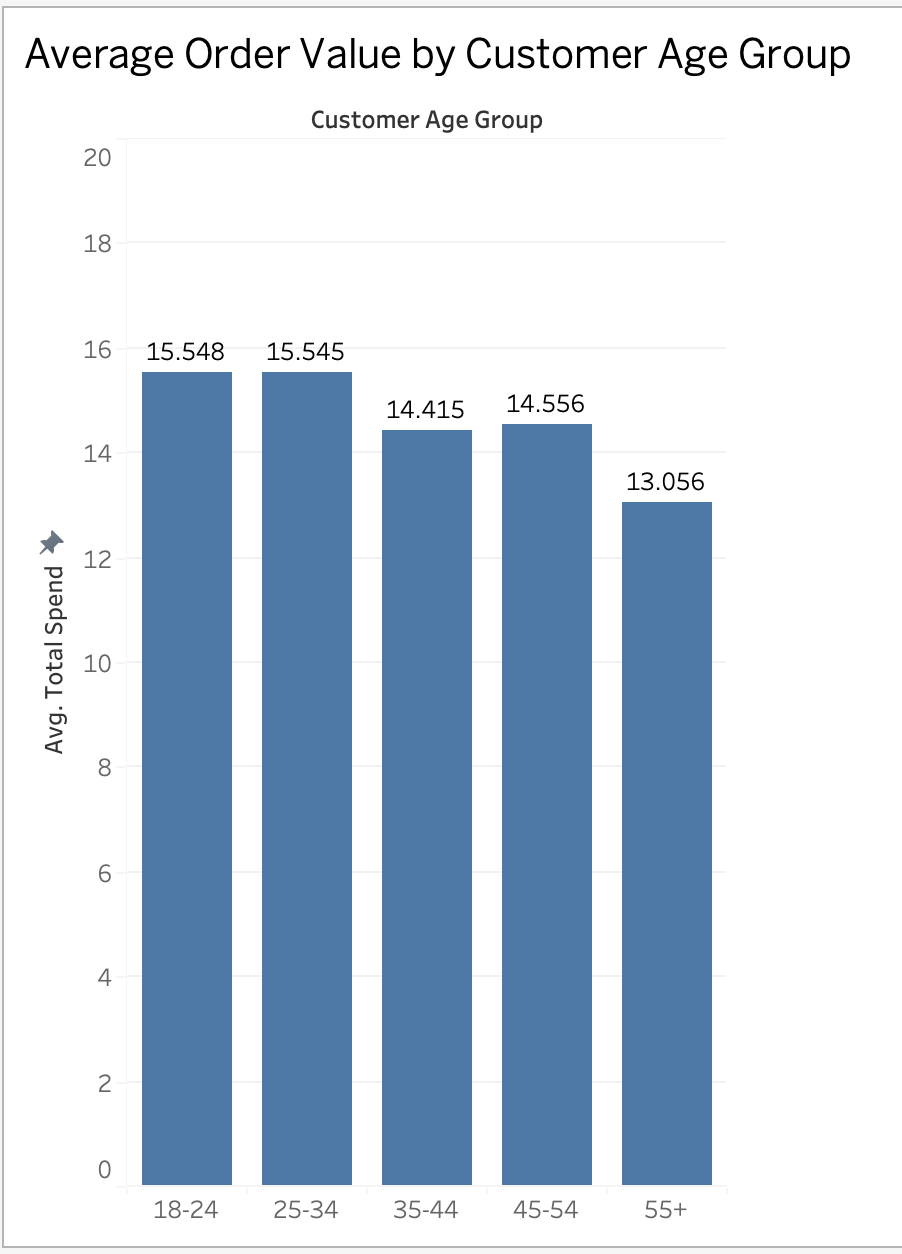
Analysis: To understand how customer spending differs across demographics, I analyzed each age group by total orders, average order value, and total revenue. This helps show whether revenue is being driven by a larger number of orders, higher spend per order, or both.
The 25–34 age group is the strongest overall segment. It placed 29,782 orders, the highest of any age group, and generated $462,952.37 in total revenue. This group accounts for nearly 30% of total order volume and about 31% of total revenue, making it the most important revenue-driving age segment in the dataset.
The 18–24 age group had the highest average order value at $15.55, only slightly above the 25–34 group at $15.54. This suggests that younger customers tend to spend more per order, but the 25–34 group generates more total revenue because they order more frequently.
The 55+ age group had the lowest performance across all three metrics, with 10,019 orders, $130,810.32 in revenue, and the lowest average order value at $13.06. This indicates that older customers may order less frequently and make smaller purchases when they do order.
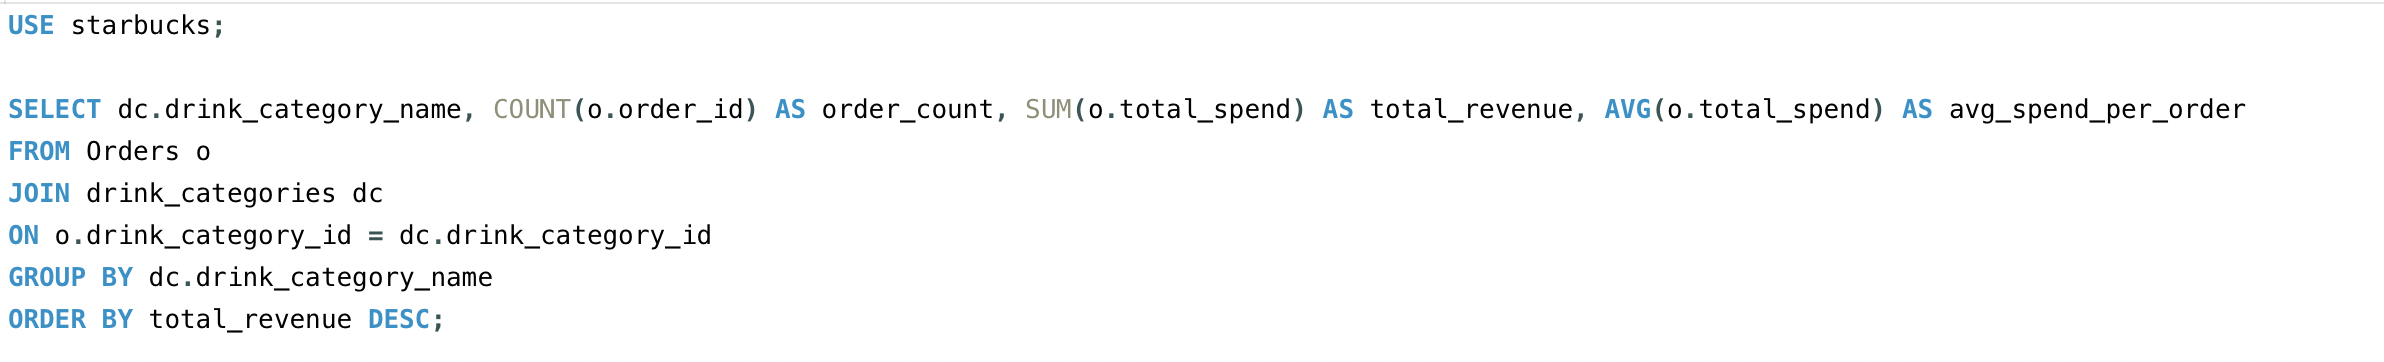
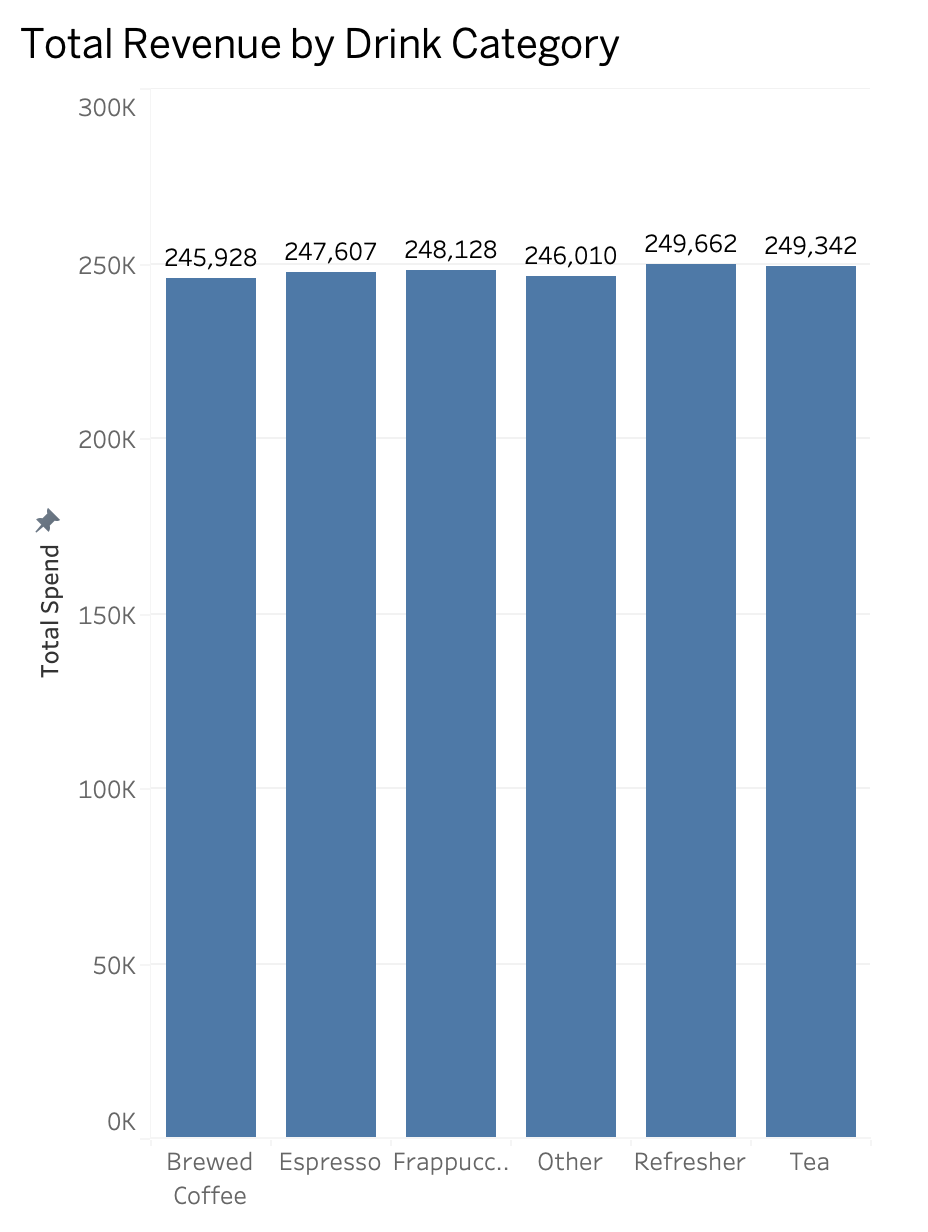
Query 3: Which drink categories perform best based on order count, total revenue, and average spend per order?
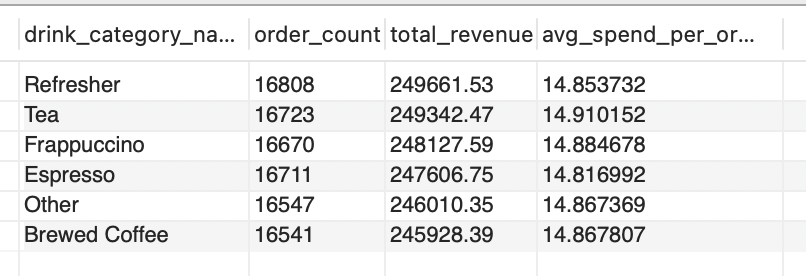
To evaluate product-level performance, I analyzed each drink category by order count, total revenue, and average spend per order. This helps identify whether certain drink categories perform better because they are ordered more often, because customers spend more on them, or because of a combination of both.
The results show that Refreshers are the top-performing drink category overall, generating 16,808 orders and approximately $249.7K in total revenue. Tea follows very closely with 16,723 orders and approximately $249.3K in revenue, while Frappuccinos rank third with about $248.1K.
However, the differences across categories are very small. All drink categories have between roughly 16.5K and 16.8K orders, and total revenue ranges from about $245.9K to $249.7K. This suggests that Starbucks’ drink revenue is fairly evenly distributed across categories rather than being dominated by one specific product type.
Advanced Queries
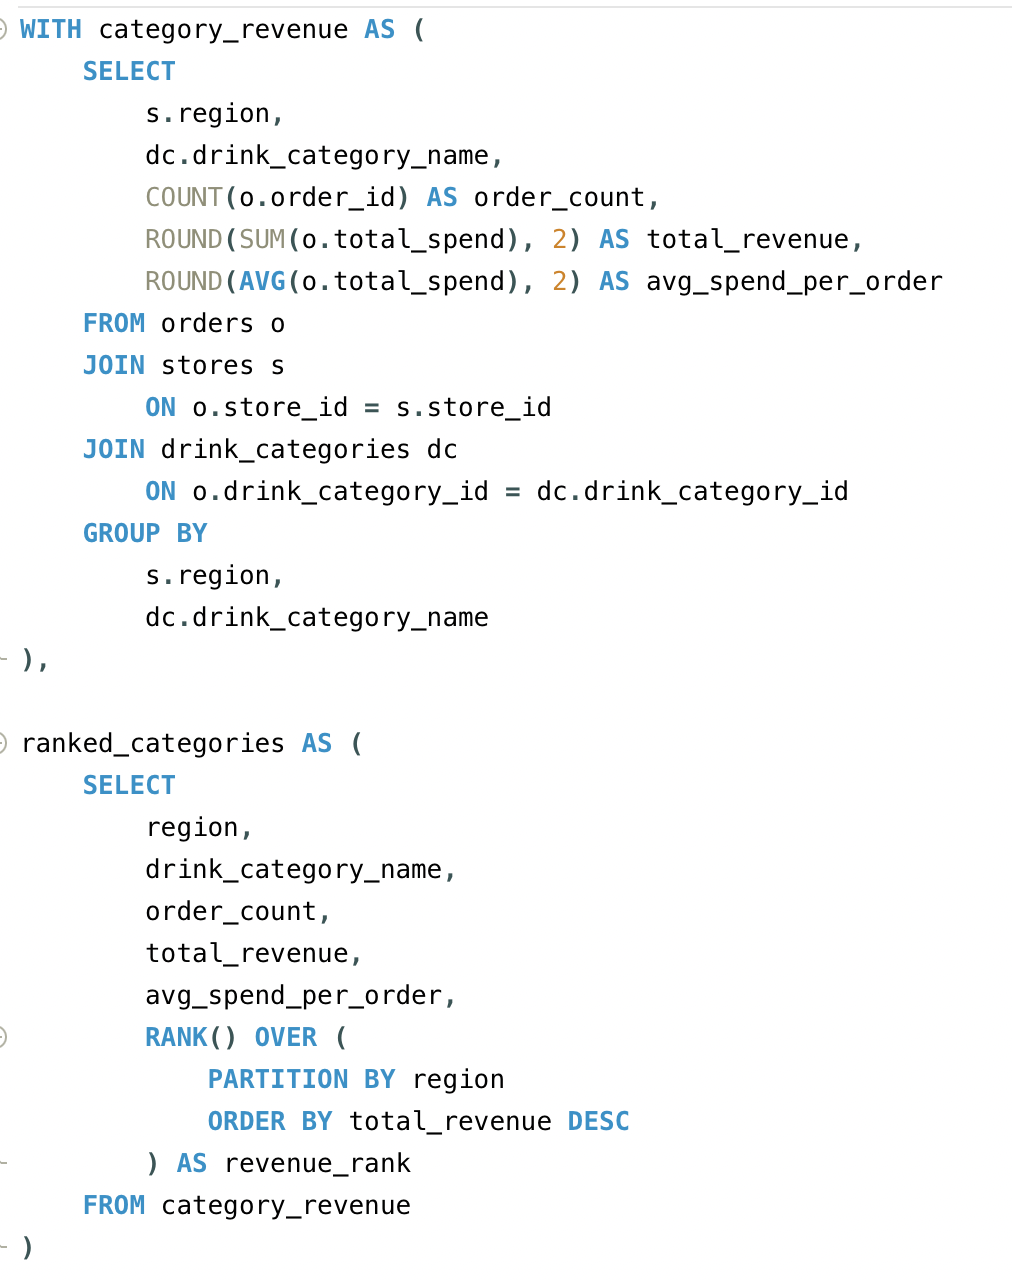
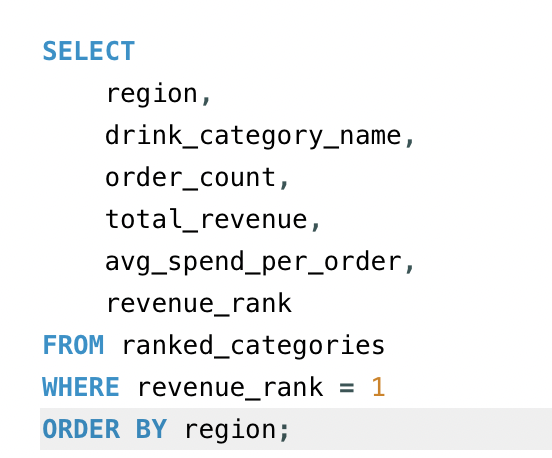
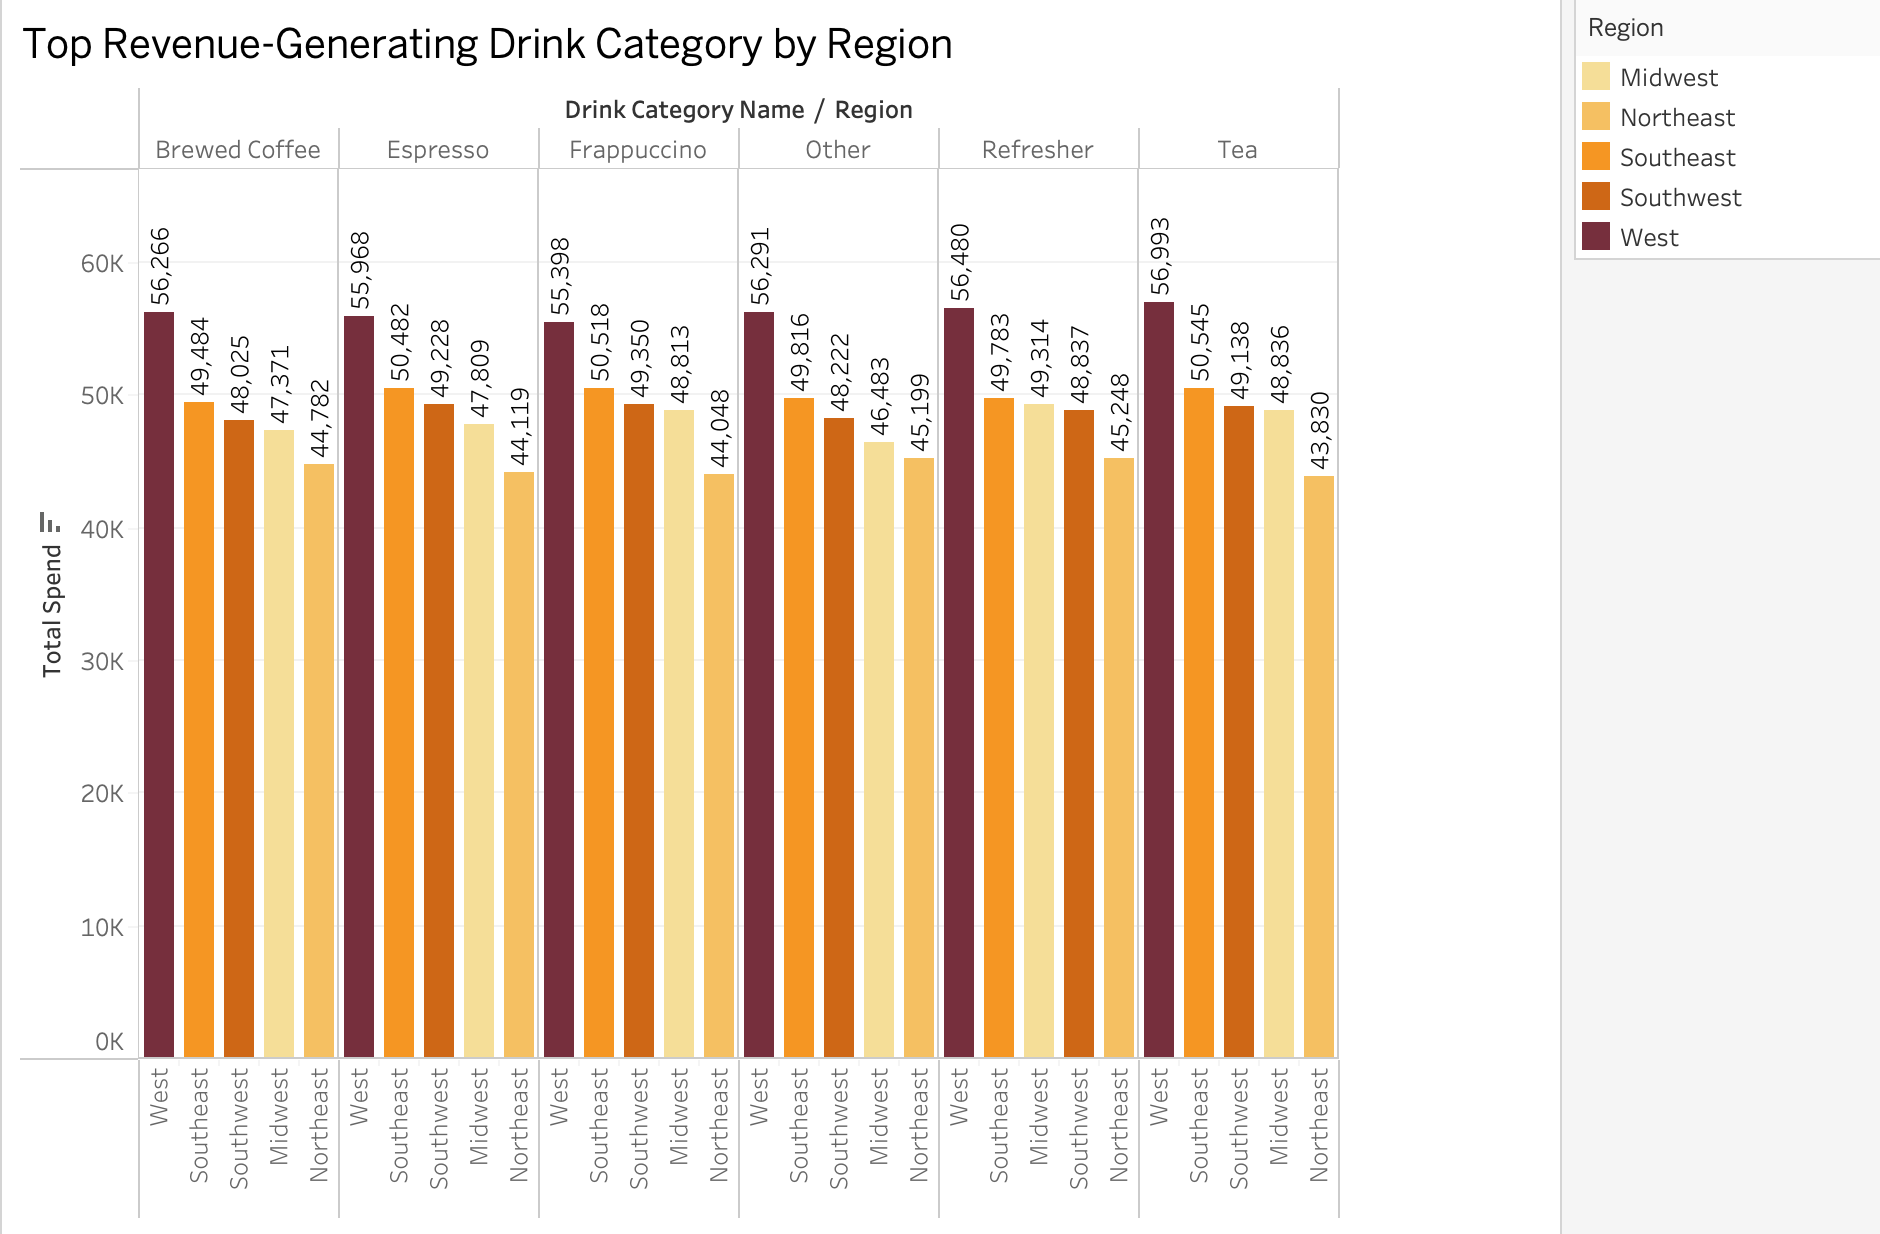
Query 1: Which drink category generates the highest revenue within each store region?
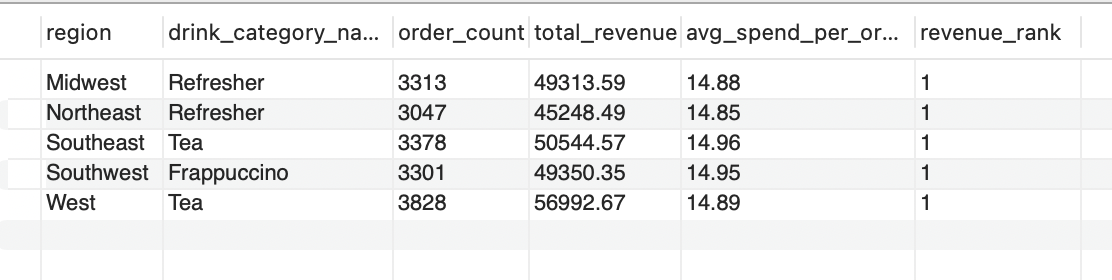
To understand whether product performance changes across markets, I analyzed the highest-revenue drink category within each region. This query used a CTE and window function to first calculate revenue by drink category and region, then rank each category within its region based on total revenue.
The results show that Starbucks’ top-performing drink category is not the same across every market. Refreshers rank first in the Midwest and Northeast, Tea ranks first in the Southeast and West, and Frappuccino ranks first in the Southwest. This suggests that customer preferences may vary by region, making localized product strategy more effective than one national promotion strategy.
The West stands out as the strongest regional opportunity, where Tea generated $56,992.67 in revenue from 3,828 orders. This is the highest revenue and highest order count among the top-ranked regional categories. The Southeast also shows strong Tea performance, with $50,544.57 in revenue and the highest average spend per order at $14.96. Together, these results suggest that Tea performs especially well in warmer or high-demand regional markets.
Refreshers show consistent strength across the Midwest and Northeast, generating approximately $49.3K and $45.2K respectively. This indicates that Refreshers may have broad appeal across multiple regions, even if they are not the top category everywhere. Meanwhile, the Southwest is the only region where Frappuccino leads, generating $49,350.35 in revenue with an average spend of $14.95, suggesting a distinct regional preference pattern.
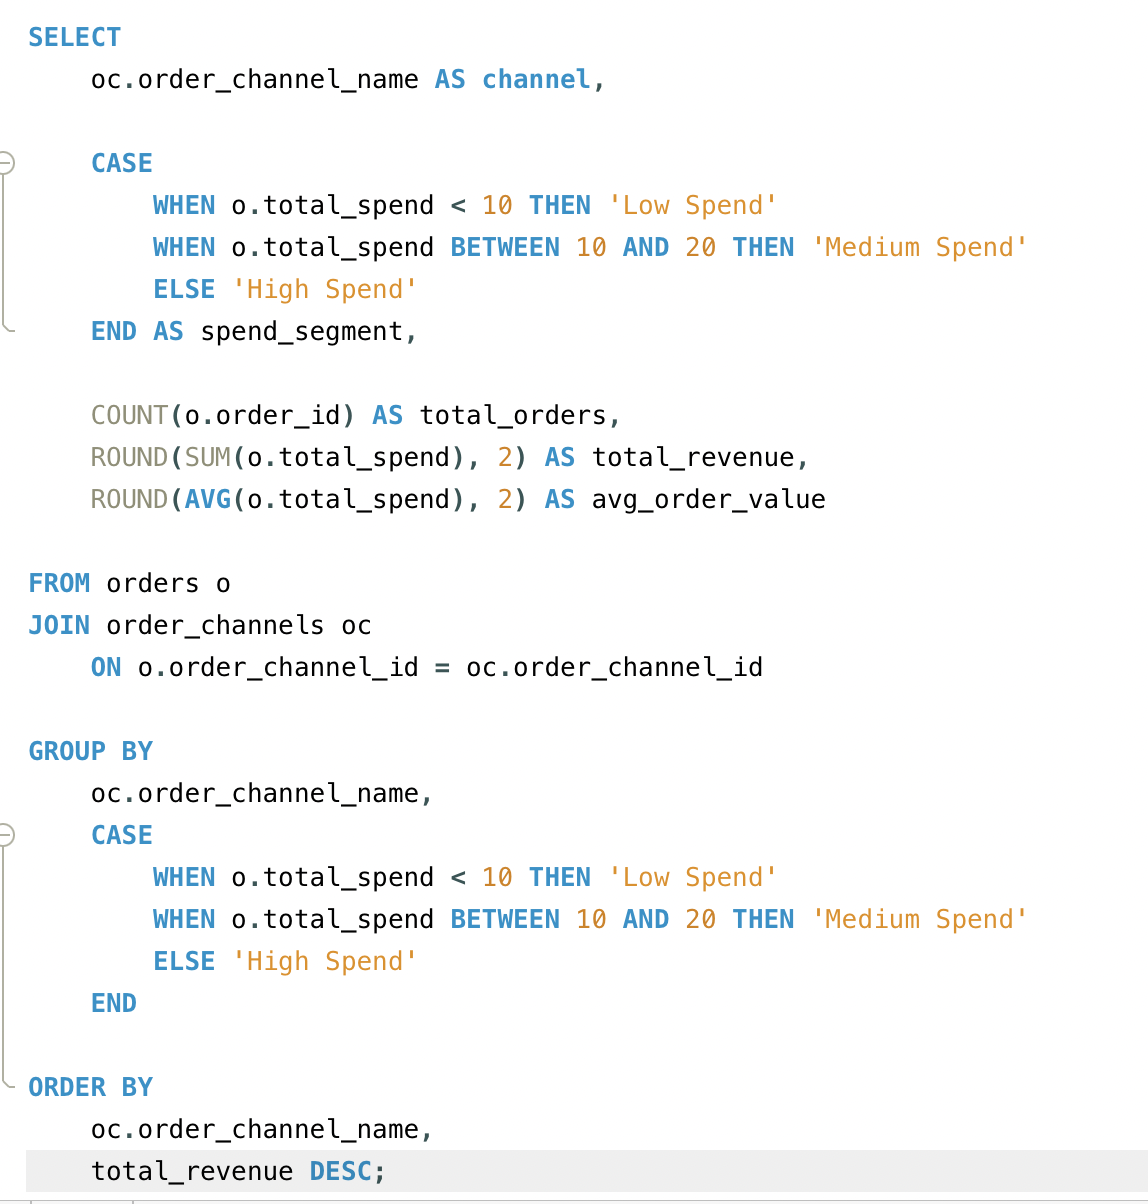
Query 2: How do low, medium, and high-value orders differ across ordering channels?
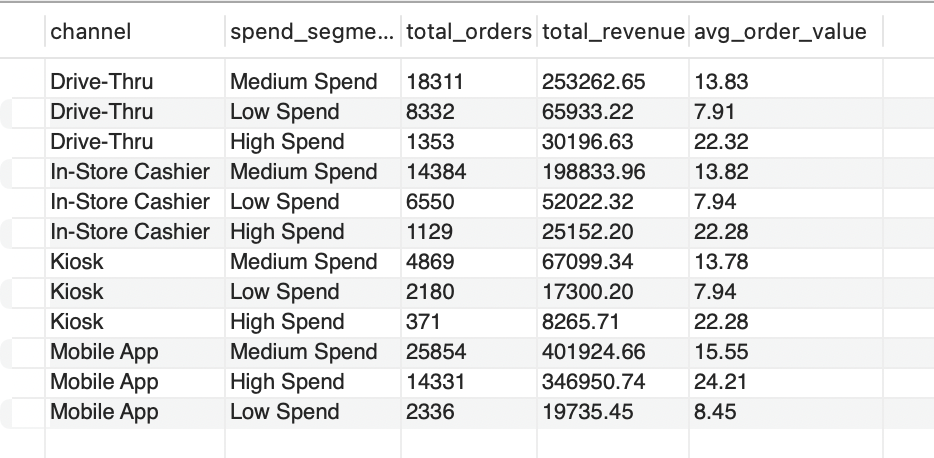
To understand why certain ordering channels generate higher average order values, I segmented orders into three spending tiers: Low Spend, Medium Spend, and High Spend. This analysis goes deeper than comparing average order value alone because it shows whether a channel’s revenue is driven by a larger concentration of high-value purchases.
The results show that Mobile App is the strongest channel for high-value orders. Mobile App generated 14,331 high-spend orders, producing approximately $346.9K in revenue from that segment alone. This is far higher than the high-spend order volume for Drive-Thru, In-Store Cashier, and Kiosk combined. Mobile App also has the highest high-spend average order value at $24.21, compared to approximately $22.28–$22.32 for the other channels.
Final Recommendations
Based on the SQL analysis and Tableau visualizations, Starbucks should focus on three main opportunities: strengthening Mobile App growth, tailoring product promotions by region, and targeting high-value customer segments more strategically.
1. Prioritize the Mobile App as the main revenue-growth channel
The Mobile App consistently outperformed every other ordering channel. It had the highest order volume, total revenue, and average order value, and the spend segmentation analysis showed that it also had the largest concentration of high-spend orders.
This suggests that the Mobile App is not just a convenient ordering method; it may actively support higher-value purchasing behavior. Customers using the app may be more likely to browse the menu, customize drinks, add food items, and respond to rewards-based offers.
Recommendation:
Starbucks should continue investing in mobile-first strategies such as personalized recommendations, rewards prompts, seasonal bundles, and add-on suggestions. Since Mobile App customers already show stronger spending behavior, the app is the best channel for increasing cart size and driving incremental revenue.
2. Use regional product preferences to guide promotions
The regional drink category analysis showed that top-performing categories differ by market. Refreshers led in the Midwest and Northeast, Tea led in the Southeast and West, and Frappuccino led in the Southwest.
This suggests that a single national product promotion may not be as effective as region-specific campaigns.
Recommendation:
Starbucks should tailor product promotions by region. For example, Tea-focused campaigns could be prioritized in the West and Southeast, while Refreshers could be promoted more heavily in the Midwest and Northeast. This approach would allow Starbucks to build on existing regional demand instead of applying the same strategy everywhere.
3. Target younger customer segments with app-based offers
The age group analysis showed that customers aged 25–34 generated the highest total revenue, while the 18–24 group had the highest average order value. Together, the 18–34 segment appears to be the strongest customer base for revenue growth.
This suggests that younger customers are both active and high-value, especially if they are also more likely to use the Mobile App.
Recommendation:
Starbucks should target younger customers with personalized app offers, limited-time seasonal drinks, rewards challenges, and bundled drink-and-food promotions. These strategies could increase repeat purchases and encourage higher cart values among customers who already show strong spending potential.
4. Investigate what drives high-spend Mobile App orders
The spend segmentation query showed that Mobile App had far more high-spend orders than the other channels. However, the analysis does not yet explain exactly why those orders are higher.
Recommendation:
Starbucks should run a follow-up analysis on cart size, food add-ons, drink customizations, and rewards membership. This would help determine whether Mobile App revenue is driven by the app experience itself or by the type of customer who prefers mobile ordering.